Welcome · based in Nyc
I'm Marion Jun — 👋🏻
a product designer who ownsthe problem behind every design decision.
Selected work
Scaling an AI-assisted design workflow
Overview
One client, four designers, four different-looking brands.
HeyBoss is a design agency in New York. As AI tools got good, each designer picked a different one, and one client's work started to look like four brands.
The problem
Every AI tool adds its own take on type, color and spacing. With no shared process, client brands drifted and the work started to look generic.
The goal
Use AI to move faster across the whole team, without losing brand consistency.
What I did
- Usage research with every designer on the team
- Side-by-side evaluation of four AI tools on the same briefs
- Client design systems loaded into each tool before any prompt
- A workflow with three routes, each tool at the stage it does best
- Rollout with two quality checks, updated as tools change
Design principles
- 01The right tool for each stage
- 02Systems over prompts
- 03Consistency by default
Final Design
 ChatGPT
 Canva
 Claude
 Figma
Wherever a designer happens to start
ChatGPTproject instructionsClaudeclient folder systemCanvabrand kitFigmacomponent libraryNot a step. A layer under every step.
Graphic design: posters & campaigns
ChatGPTgenerate + art directCanvabrand kit + layer editingInformational content: carousels
Claude Designgenerate + editCanvafine iterationWebsites
Claudesystem + structureClaude Codeinto FigmaFigmamanual + Figma MakeClaude Codesystem applied, working hi-fi prototypeReviewClaude critiqueContext
A shared design process existed before AI.
Content and websites each had a written process the whole team agreed on.
Content design
Website design
Problem
AI tools fragmented the process and the brand.
As client volume grew, each designer drafted in a different AI tool. It was faster, but it created two problems.
What actually happened
ChatGPTClaudeFigma AICanva AIEvery tool adds its own take
Typefaces, spacing, color all drifted from the brand. Never by much, but enough that no two pieces matched.
And each drifts a different way
With four tools in play, one client ended up with four versions of their brand.
On top of that, the work started to look generic.
Research
Separating tool limits from personal habits.
I interviewed every designer about which tools they used and where they got stuck, then ran the same briefs in each tool. Shared pain points meant a tool limit; the rest was habit.
ChatGPTCanvaClaudeFigmaFindings
Each tool excelled at one stage and fell short at another.
ChatGPT
- Best for
- Image generation, illustrations and poster drafts. Strongest visual hierarchy of the four.
- Falls down
- No manual editing, only regenerating. Weak at holding a design system.
Canva
- Best for
- Direct editing, brand kits and templates.
- Falls down
- Hierarchy is inherited from templates, so it reads flat. Weaker image generation.
Claude
- Best for
- Best at holding a design system. Structured work like carousels and websites. Useful critique.
- Falls down
- Even emphasis, no focal point. Weak on expressive work like posters.
Figma
- Best for
- Direct editing, applying an existing system, interaction and motion.
- Falls down
- Symmetry by default, so output trends generic. Edits reach beyond what was asked.
Key Insight
Generic output was a design system problem, not a prompt problem.
Figma pulled its "Make Designs" feature in 2024 because the results looked like existing apps. They blamed the design system it drew from, not the model. I was seeing the same thing.
If what a tool references is generic, the output is generic, no matter how good the prompt is.
So instead of better prompts, I changed what the tools reference. Each client's design system is loaded into the tools up front, so no one has to type or reinterpret brand rules.
Implementation
Workflow rules and quality guardrails.
Two guardrails, every time
The workflow buys back time for judgment. It doesn't replace it.
Impact
Faster turnaround, with no extra revision rounds.
All four designers now follow the same workflow, so a client's work stays consistent no matter who made it.
Before → with the workflow
Carousel post set
Poster or campaign graphic
One-page website
Client revision rounds
Same as before, even with faster turnaround
The website route keeps the idea behind our component library: set the client's design system first, then build every page from it. It just gets there a lot faster now!
Ongoing
When new tools or features ship, I test them against the same four criteria and update the routes if the ranking changes.
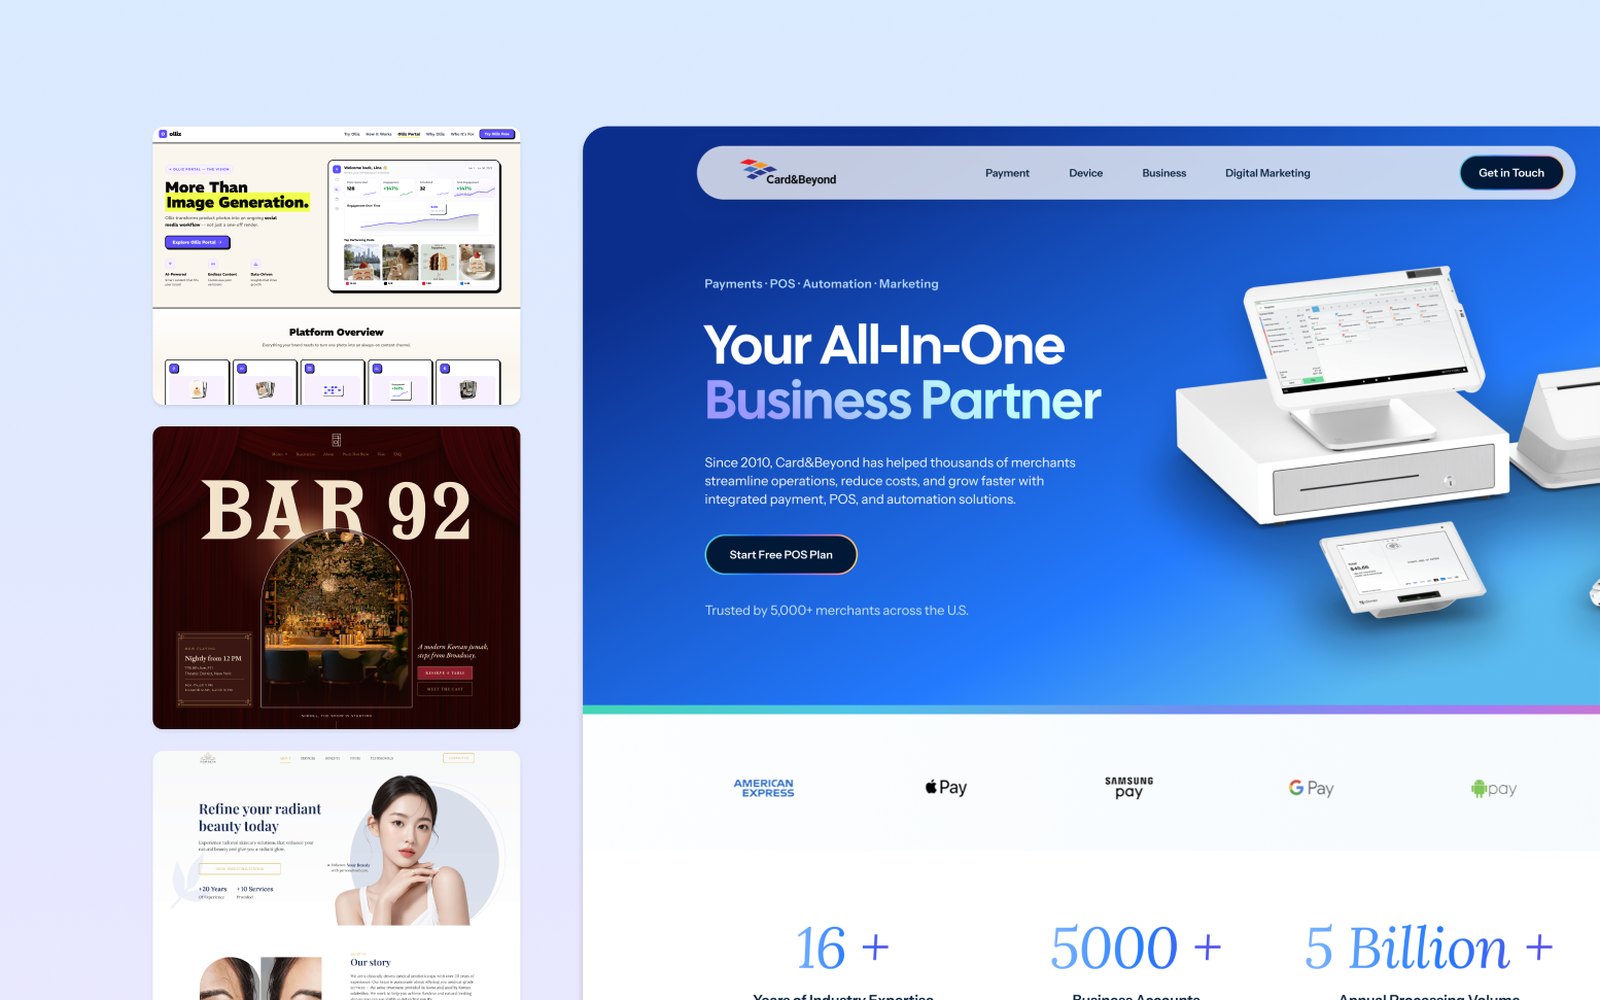
Converting ad traffic for a payments company
Overview
Paid ads were bringing traffic, but visitors left at 20–30% scroll depth and inquiries weren't coming in. Every ad pointed at the homepage, a page built for browsing, with no form anywhere. I rebuilt the ad destination around one action: leave your contact.
What I did
- Found where the ad-to-page funnel lost attention
- Turned "it looks old" into five design requirements
- Moved ad traffic off the homepage onto its own page
- Designed the page around the questions a stranger asks, in order
- Rebuilt palette, type and imagery, and shipped it with the dev team
My impact
More visitors reached the ask, stayed longer and converted. The biggest gain came from a form placed where the old page lost people.
Final design preview

Scroll inside the frame to view the full page.
Context
Good traffic arriving at a page built for a different visitor
Ad traffic is a stranger who needs to understand the business in seconds. The homepage offered detail they hadn't earned yet, no hook, and no form.
The page's job: prove to a stranger that one company covers all four services: payments, devices, business tools and marketing.
Why it read as dated
"It looks old" is an impression, not a brief
Five things were producing it.
The previous site

Scroll inside the frame to view the full page.
- The headline says nothing about the business"Your Trust and Success Shape Our Future" could belong to any company.
- One magenta marks everythingWhen a color marks everything, it marks nothing.
- One centered rhythm, repeatedNo edge to scan from, and nothing stands out.
- The core claim as ornamentThe all-in-one idea, in the smallest type on the page.
- Fifteen-plus asks, no formA page asking for fifteen things is asking for nothing.
Design requirements
Translating one goal into five things the design had to do
One goal: a stranger from an ad leaves their contact details. Working back from it gave five requirements.
| Requirement | Why it wasn't happening | What the design had to do |
|---|---|---|
| Immediate category read | Sentiment headline, food photo | Say what it sells in the first screen |
| All-in-one claim made visible | Small decorative badges | Four pillars get their own early section |
| Credibility established fast | Trust marks buried, anonymous testimonials | Proof at the top, one named testimonial |
| A current, competent surface | One loud accent, everything centered | A restrained palette with real hierarchy |
| A conversion point that exists | No form on the page | A form where attention was being lost |
Structure
Stop routing ads to the homepage
Ad traffic gets its own page that answers the ad's promise and asks for the contact on the same page.
Before
After
Six questions
Visitors leave at the first question that goes unanswered
Not what the client wanted to say, but what a stranger needs answered, in order.
| # | The question | What answers it |
|---|---|---|
| 01 | "Is this what I just clicked?" | The page echoing the ad's own language |
| 02 | "What does this company actually do?" | Category clarity, before any detail |
| 03 | "Can I trust them with my business?" | Third-party marks and scale proof |
| 04 | "Is this current, or old technology?" | The design itself, more than the copy |
| 05 | "Does this apply to a business like mine?" | Industry and device specifics |
| 06 | "What does it cost me to ask?" | Risk reversal, right at the form |
Answer enough to be credible. Not enough to be finished.
A visitor with every question answered has no reason to get in touch, so each section gives the core and stops short.
Visual system
Every decision here corrects something specific on the old page
Color
- Royal blue as the field. The category color of payments, in a gradient that reads current.
- Accent on two phrases only: "Business Partner" and "Free POS Plan".
- Five levels instead of two, so emphasis comes in degrees.
- Warm gradients in one section only, the device mosaic.
Typography & imagery
- One geometric sans, hierarchy from size, not color.
- Left-aligned by default, with an italic serif only for the testimonial voice.
- Real product in the hero, replacing a food photo.
Section by section
What each part of the page is for
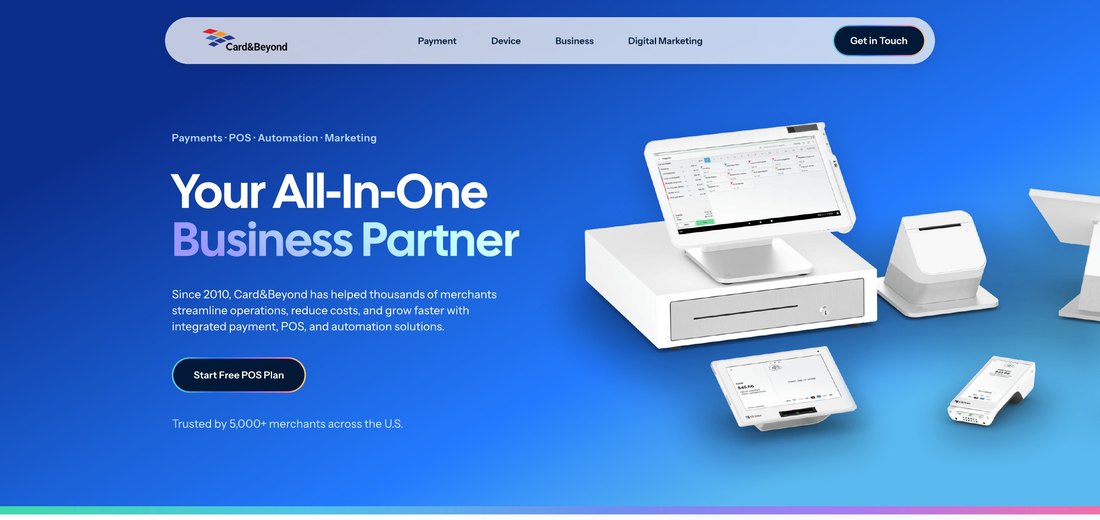
Header & hero
Mirrors the ad's language. One action, naming the offer.

Payment brand strip
Wallet and card marks right under the hero, where proof is needed.

Proof band
Longevity, scale and money handled, early, before detail.
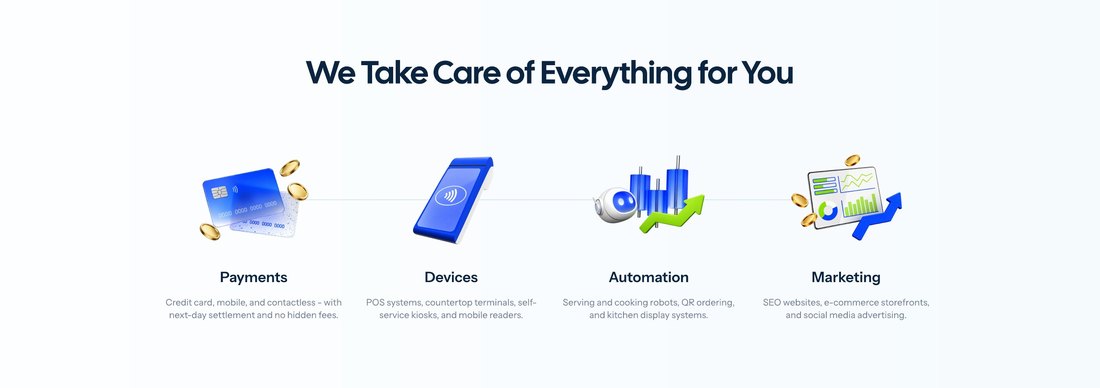
All-in-one overview
The four pillars, before the first ask. Quiet on purpose.
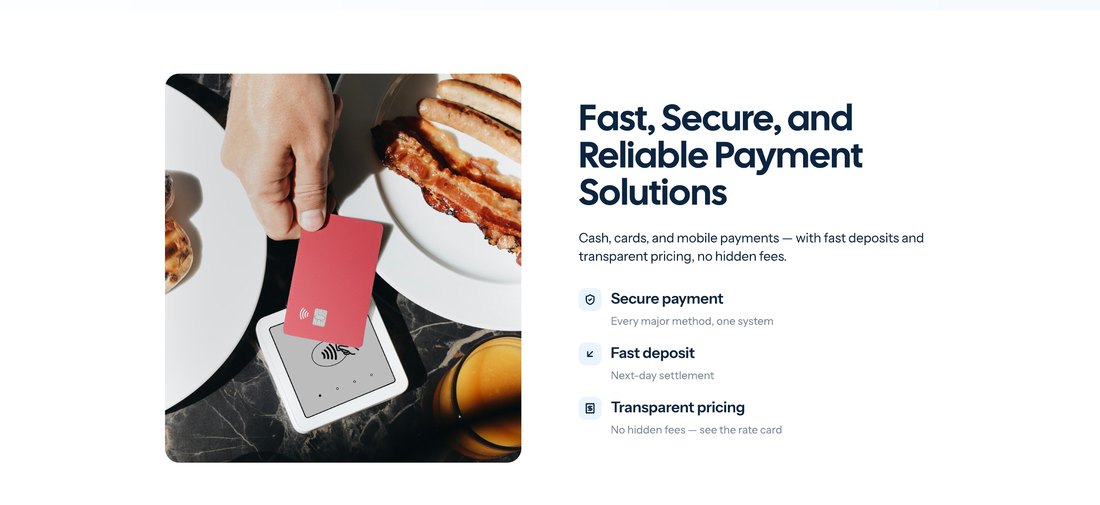
Payment processing
Answers the three objections to switching: safety, payout timing, hidden fees.
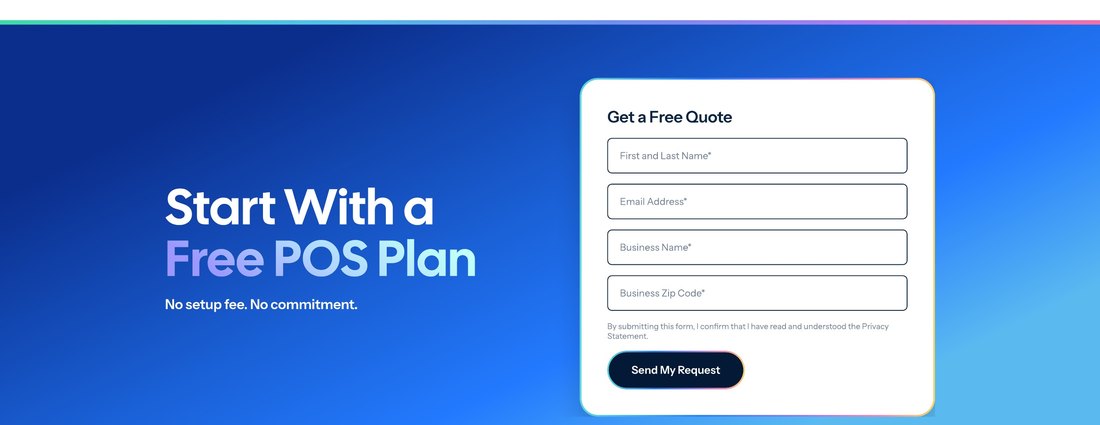
First form, at the drop-off point
A full-width form at 20–30% depth, exactly where the old page lost people. Four fields.
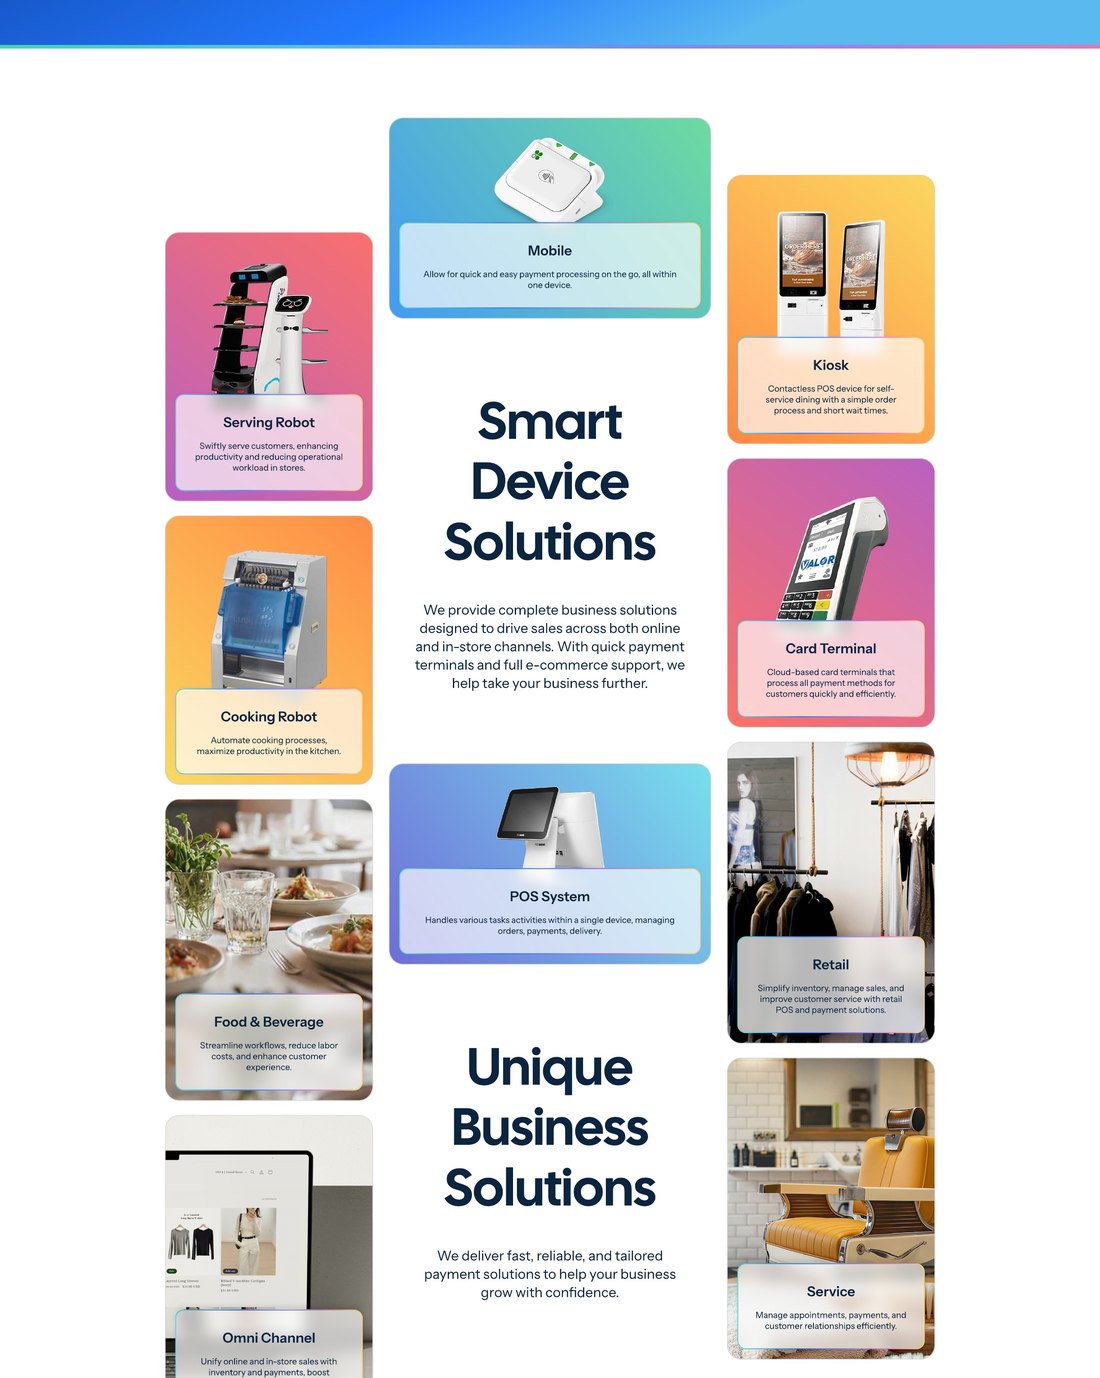
Devices & business types
Devices mixed with industries, so visitors find their own.
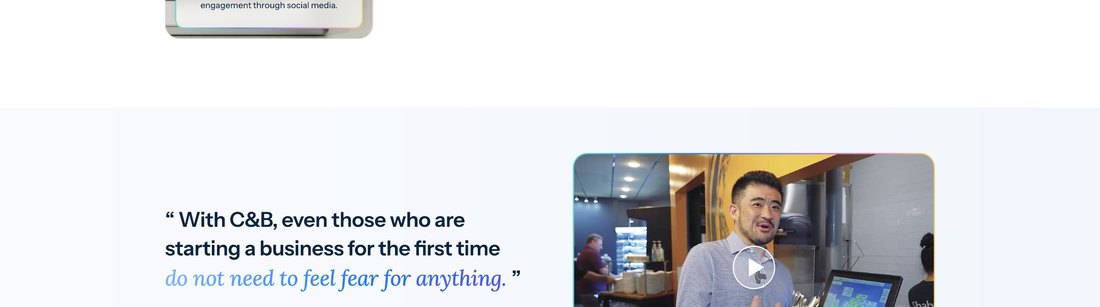
Testimonial
One named local business on video, replacing eight anonymous cards.
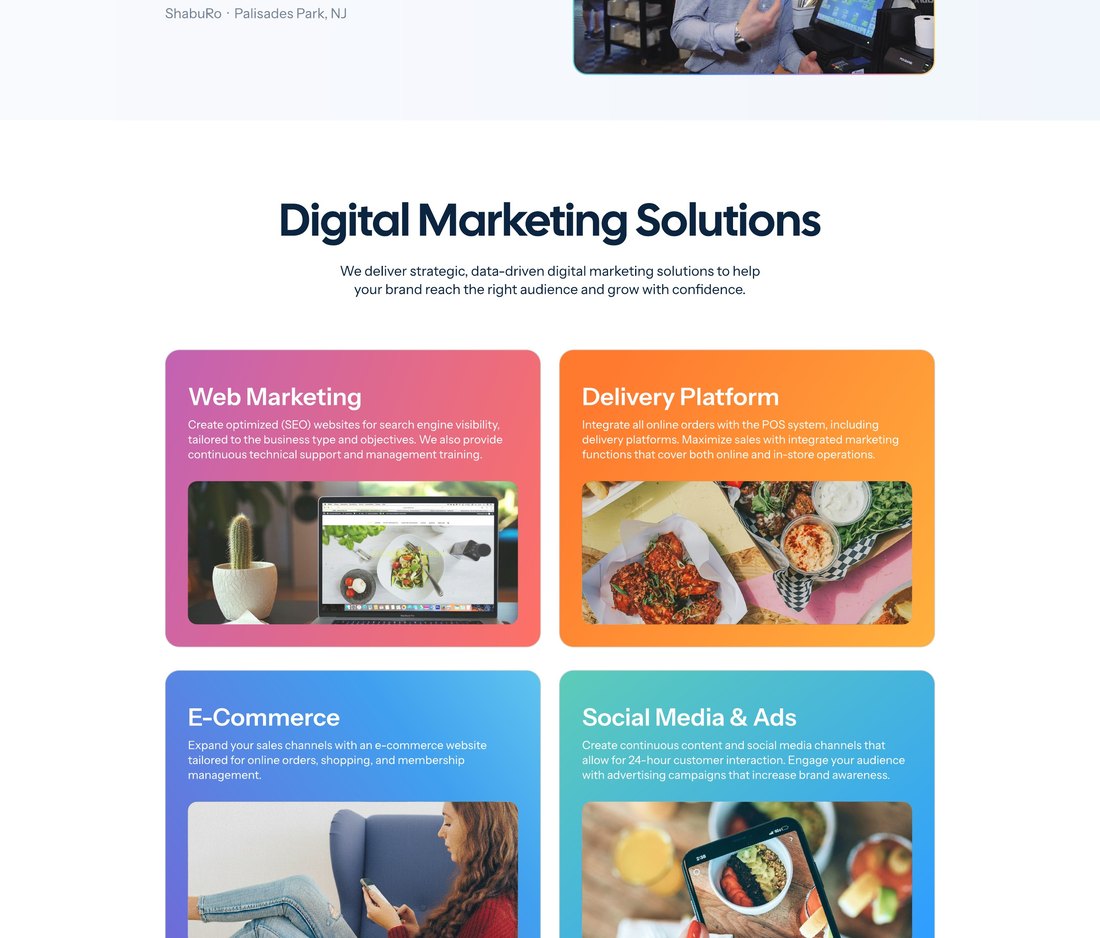
Digital marketing
The pillar merchants least expect, so it gets a section.
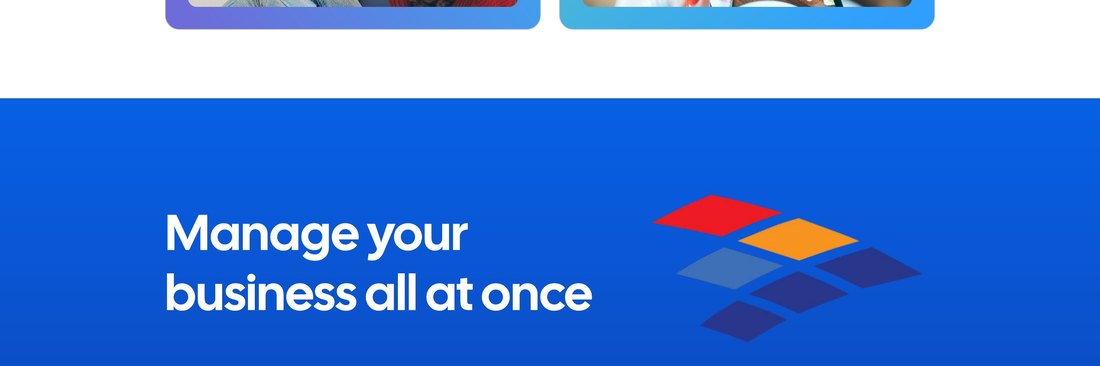
Closing
Three concrete reasons, replacing a slogan.
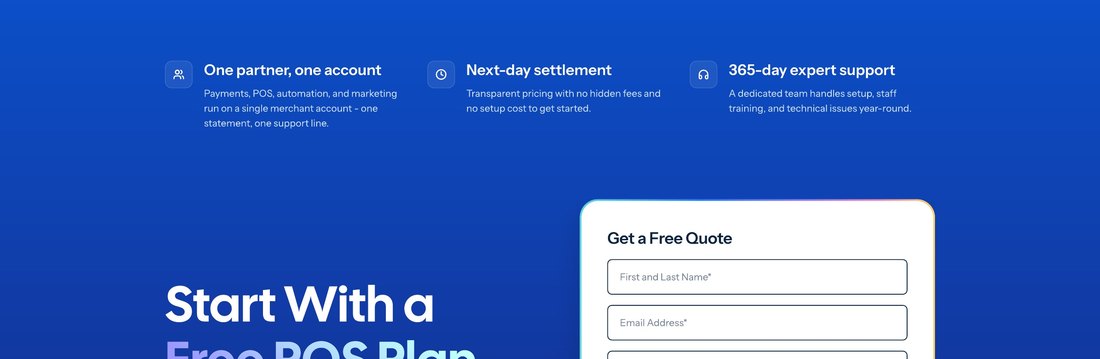
Second form
Same offer again, for late deciders.
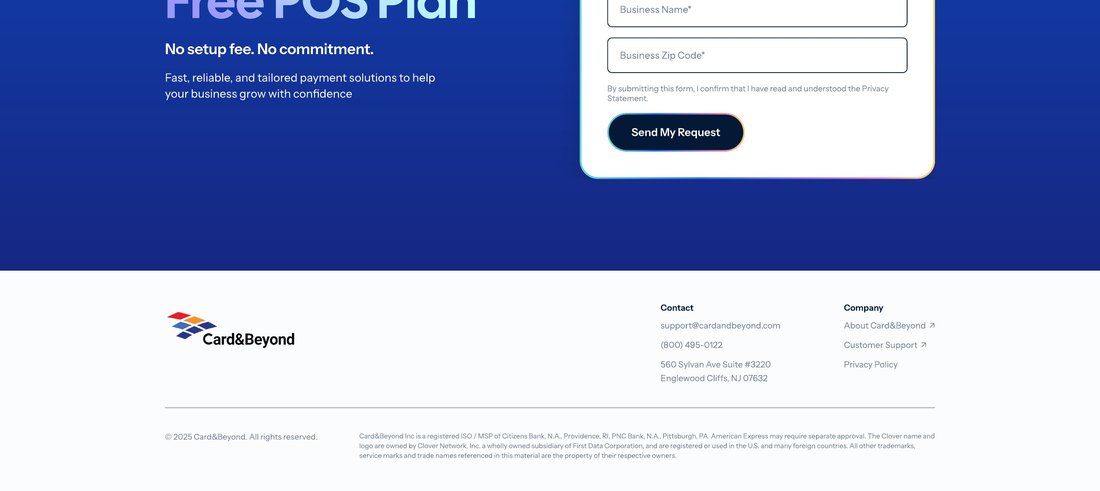
Footer
Contact info only. Every extra link is an exit.
Scroll depth
The same 20–30% band: where the old page lost most people, and where the new page now puts its first form.
Before
After
Impact
What changed
Submissions split about 60/40 between the first and second form, confirming early and late deciders are worth serving separately.
Reducing drop-off in a payments acquisition funnel
Overview
The ads were working. The page they landed on wasn't.
Card & Beyond sells payments, POS devices and business tools to small businesses across the U.S. Its ads drove clicks, but almost no one reached out.
The problem
Ad traffic landed on a homepage built for browsing. Visitors couldn't tell what the company sold or what to do next, and only 0.9% sent an inquiry.
The goal
Turn ad clicks into inquiries with a landing page built around one clear reason to choose.
What I did
- Site and ad funnel audit
- Behavior analysis with heatmaps and session recordings
- Two landing page iterations, from information architecture to UI and copy
- A new value proposition: one partner for every business need
- A brand page and four product pages on one system
- Alignment with the client and the ad team on one message
Design principles
- 01Minimize cognitive load
- 02Reduce decision friction
- 03Lower perceived risk
Final Design

Scroll inside the frame to see the full page.
Context & Problem
Ad traffic was landing on a page built for browsing, not converting.
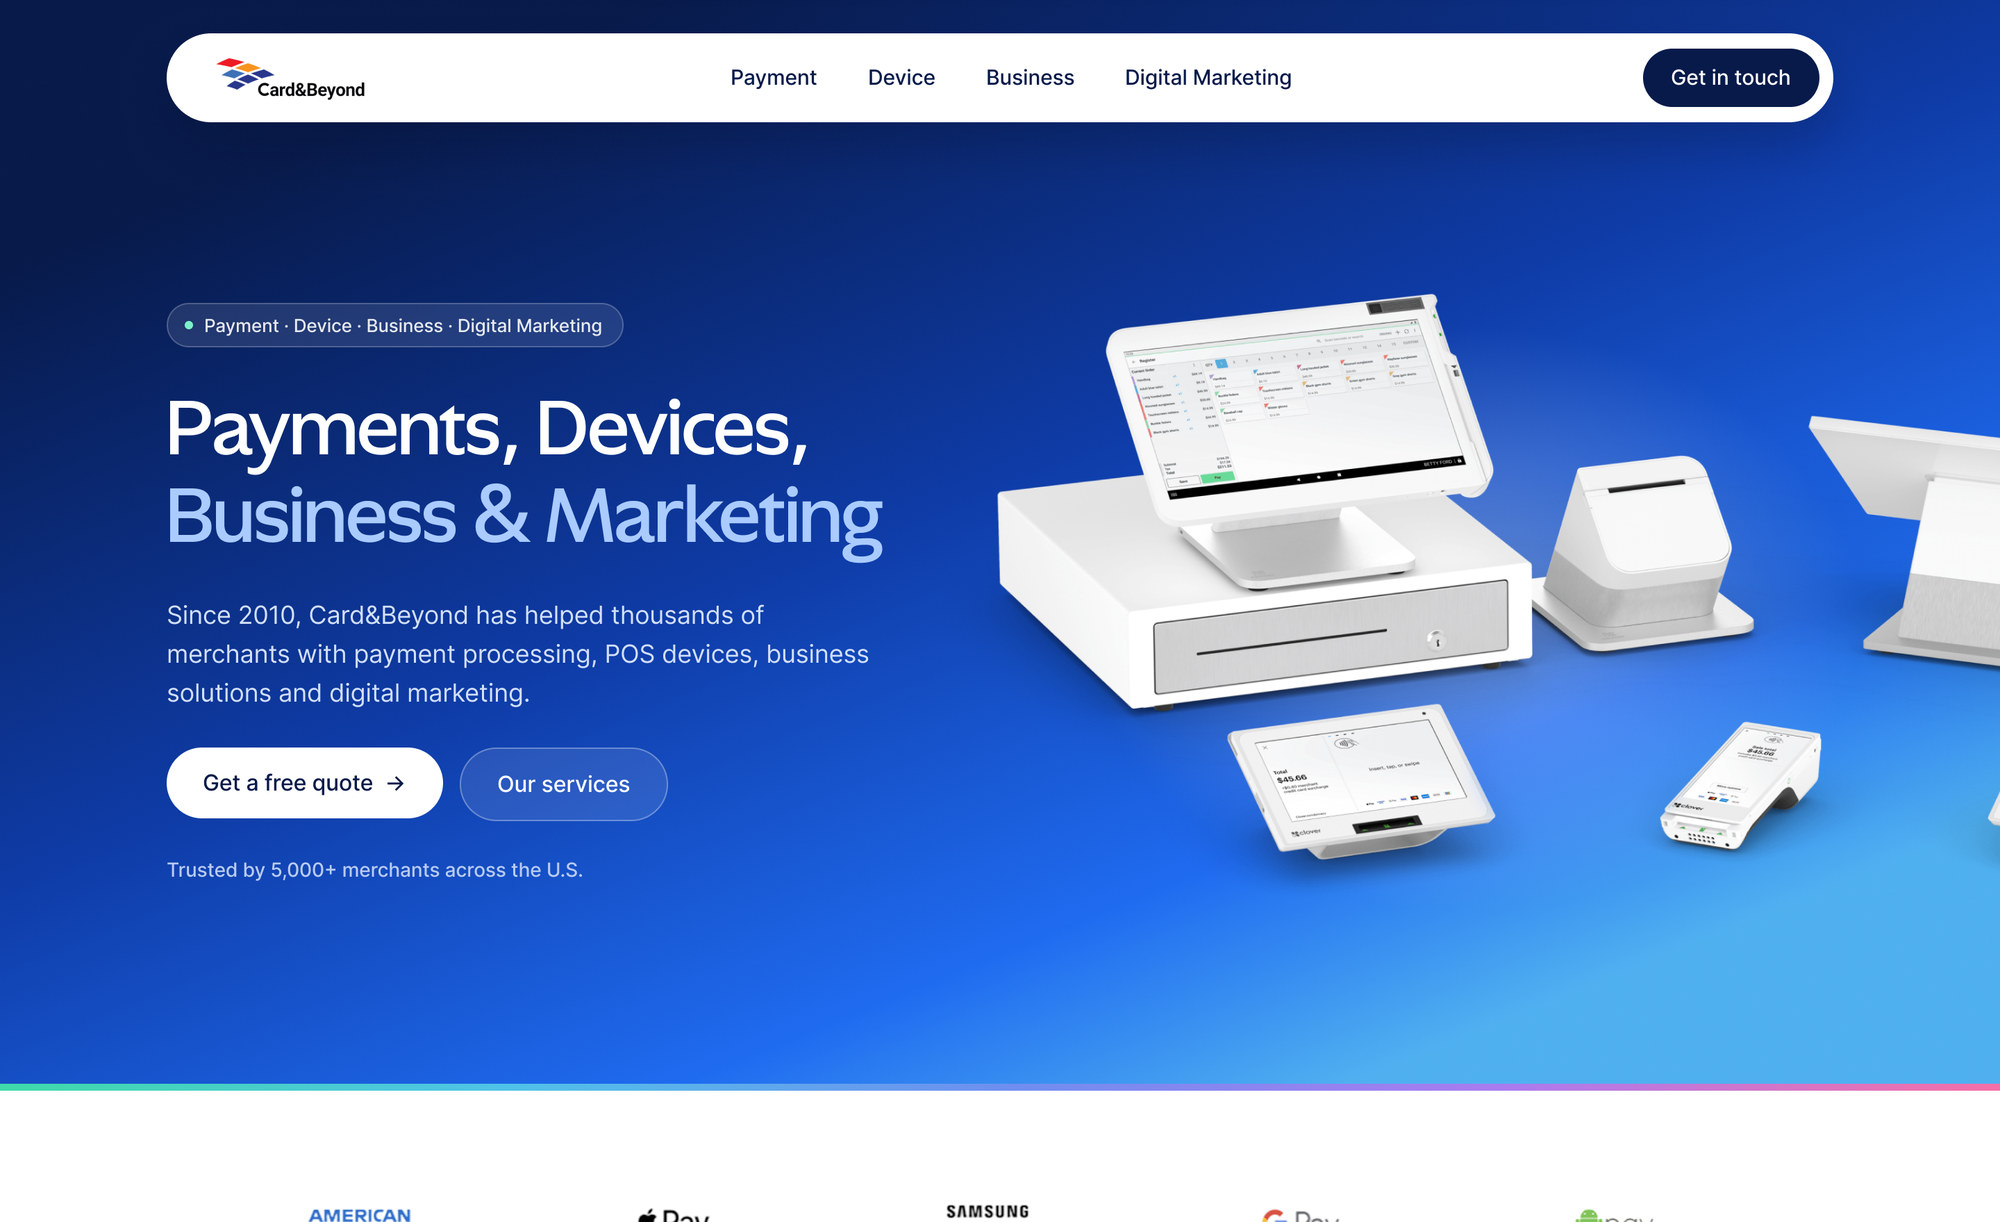
The ads linked straight to the company website. It gave four business lines equal weight, so nothing stood out and it was hard to tell what the company sold.
The old website
Scroll inside the frame to see the full page.
- A headline that could be any company's"Your Trust and Success Shape Our Future."
- One magenta on everythingSo nothing stood out.
- "All-in-one" in the smallest type on the pageTheir strongest claim, hidden.
- 15+ things to click, 0 formsAsking for everything is asking for nothing.
Target user
A restaurant, shop or salon owner who didn't search for the brand. Switching payment providers feels risky, and they decide in seconds.
So I proposed a dedicated landing page for ad traffic, and left the website for people browsing on their own.
Iteration 1
Iteration 1 improved clarity and added a clear next step.
The client wanted all four business lines on the page, so I kept them and restructured the page for visitors arriving from an ad.
Old website
Version 1

Version 1 went live. More people stayed and reached a form, but inquiries stayed below target.
Data Analysis
Engagement improved, but the value proposition was still unclear.
Where visitors stopped
One good sign: about 60% of submissions came from the first form, so many visitors were ready to act early.
Session recordings revealed four usability issues:
Many still left from the first screen. Version 1 fixed the website's problems, but the data pointed to the real one: there was no reason to choose.
Reframing the Problem
Reframing the problem around one value proposition.
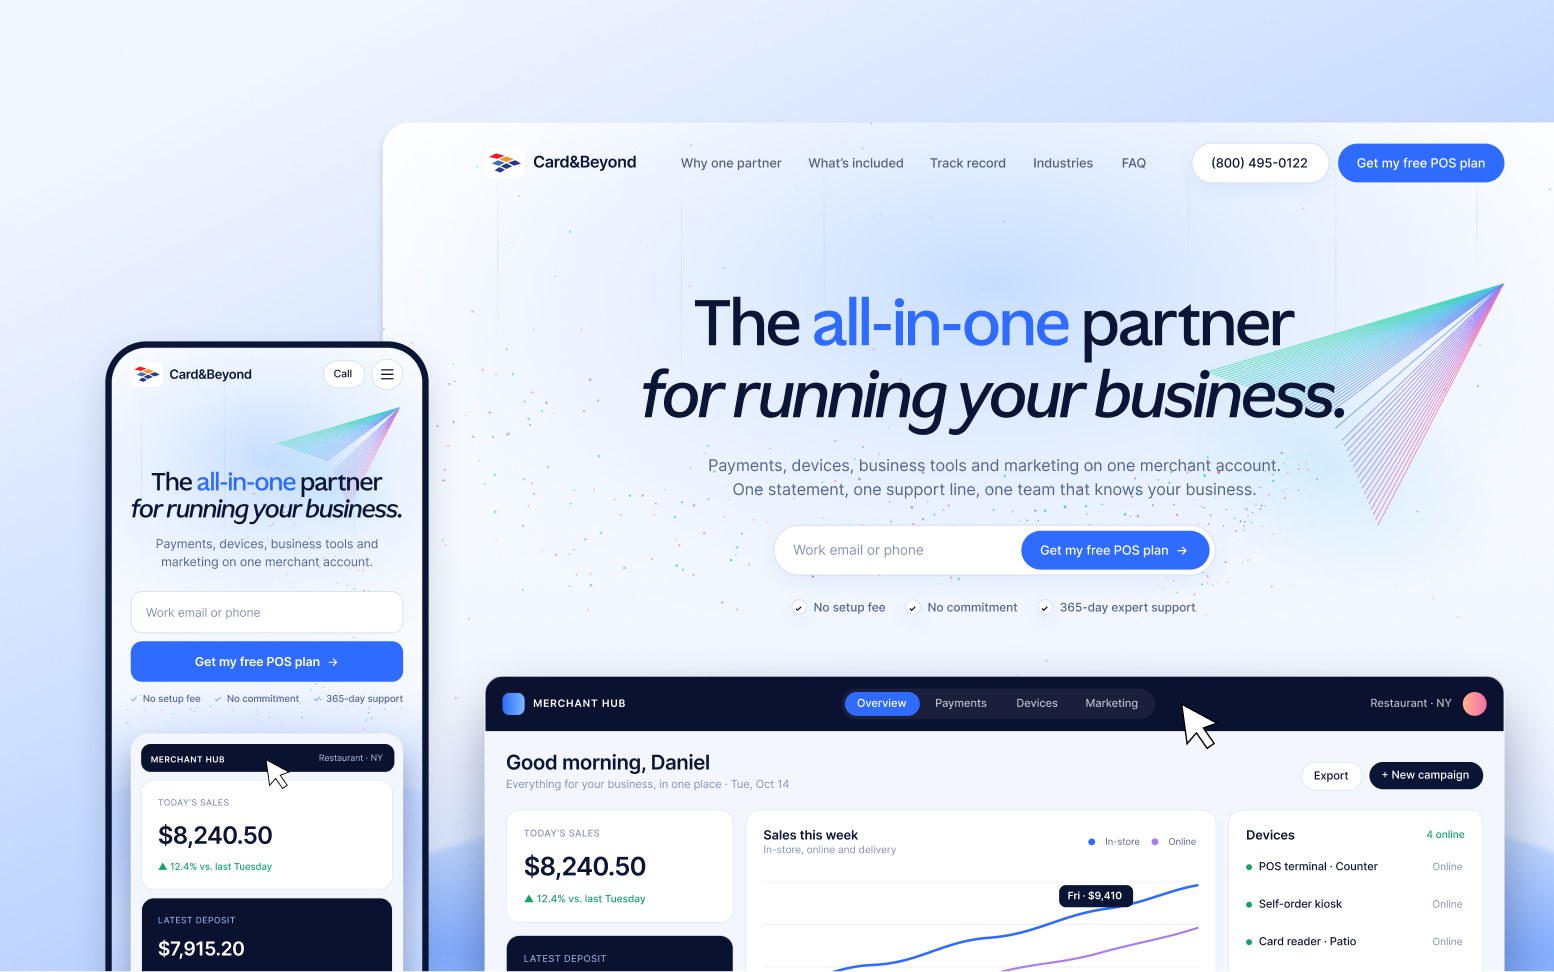
The answer was already in the business: one partner for payments, devices, software and marketing, so an owner doesn't juggle four vendors. That became the value proposition, "the all-in-one partner for running your business," and the ads were rebuilt around it too.
Iteration 2
Iteration 2 follows the user's decision path.
Each section answers one user question, and forms sit where users are most ready to act.
Version 1
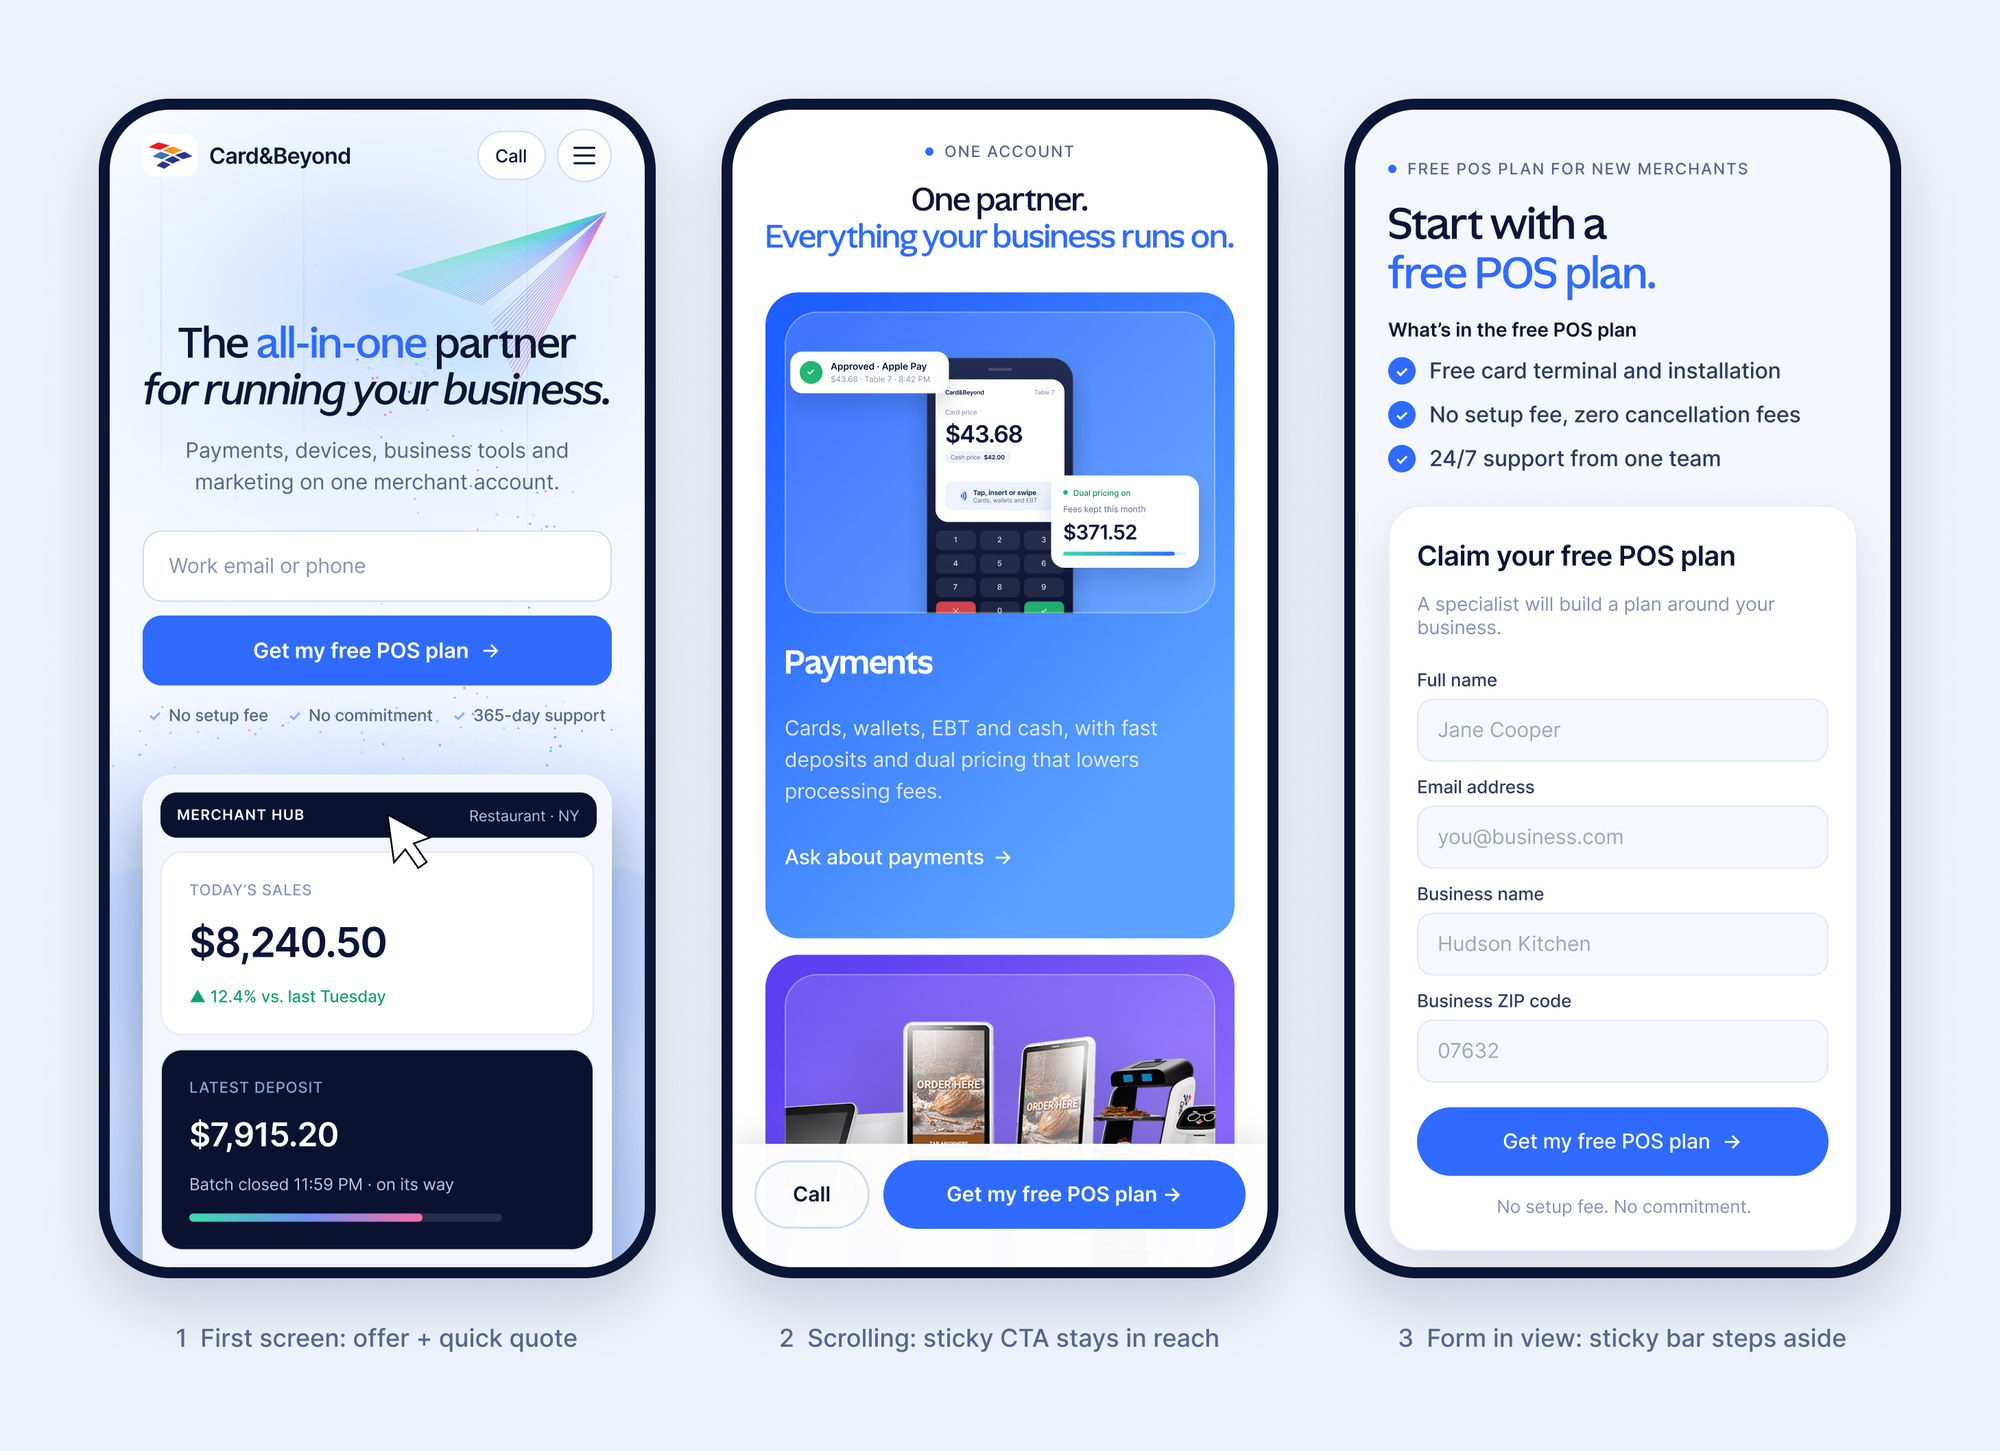
Version 2
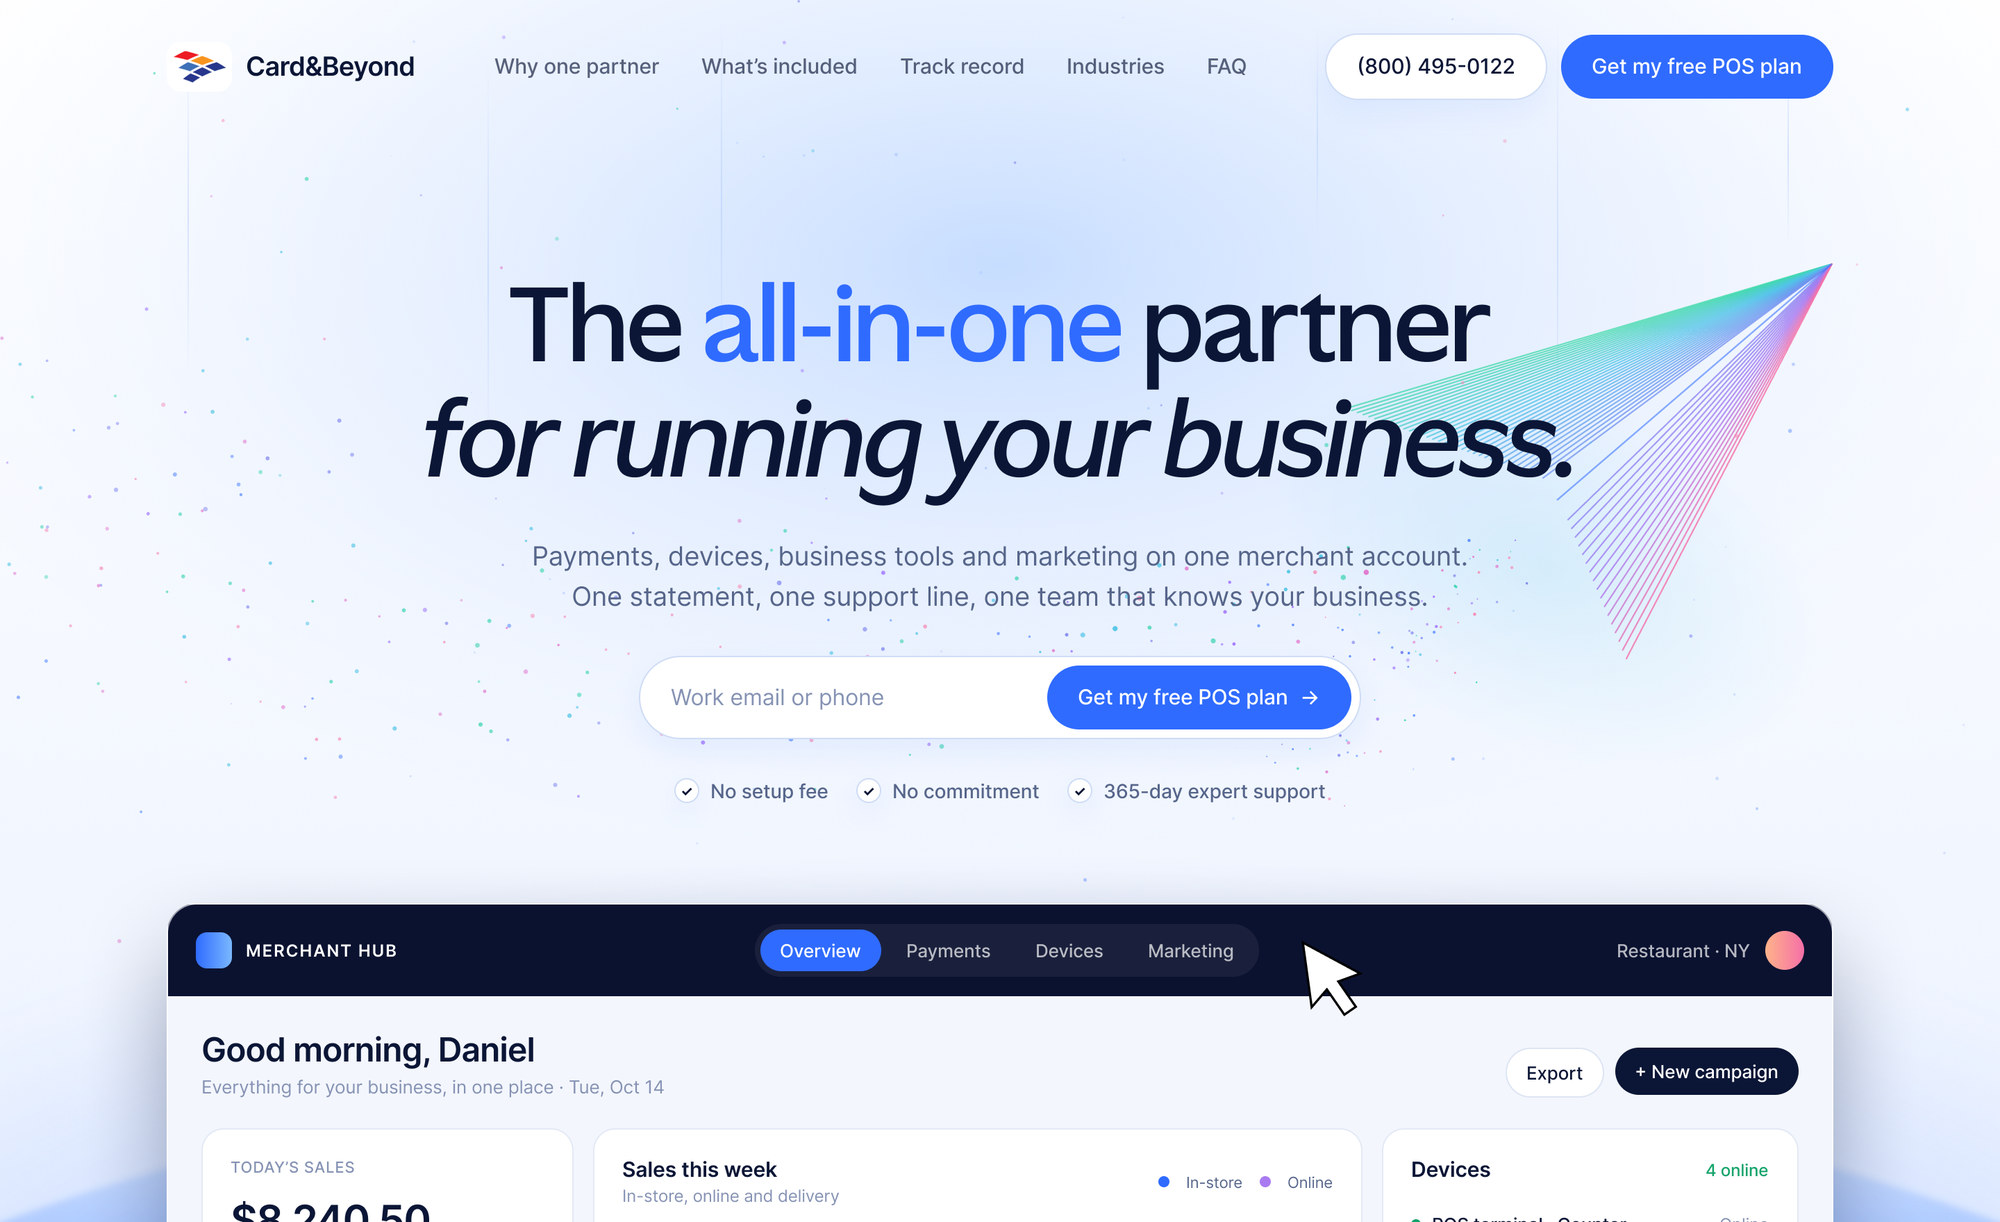
- A quick quote field in the heroMost submissions came from the first form, so users can act from the first screen.
- One button everywhere: "Get my free POS plan"The strongest offer became the call to action, and every link stays on the page.
- A real merchant dashboardSales, devices, deposits and marketing in one view. All-in-one you can actually see.
- Trust before the askA bank registration line under the hero, and a review and FAQ before the final form.
Visual Design
Tuning the visual tone to lower the barrier to inquire.
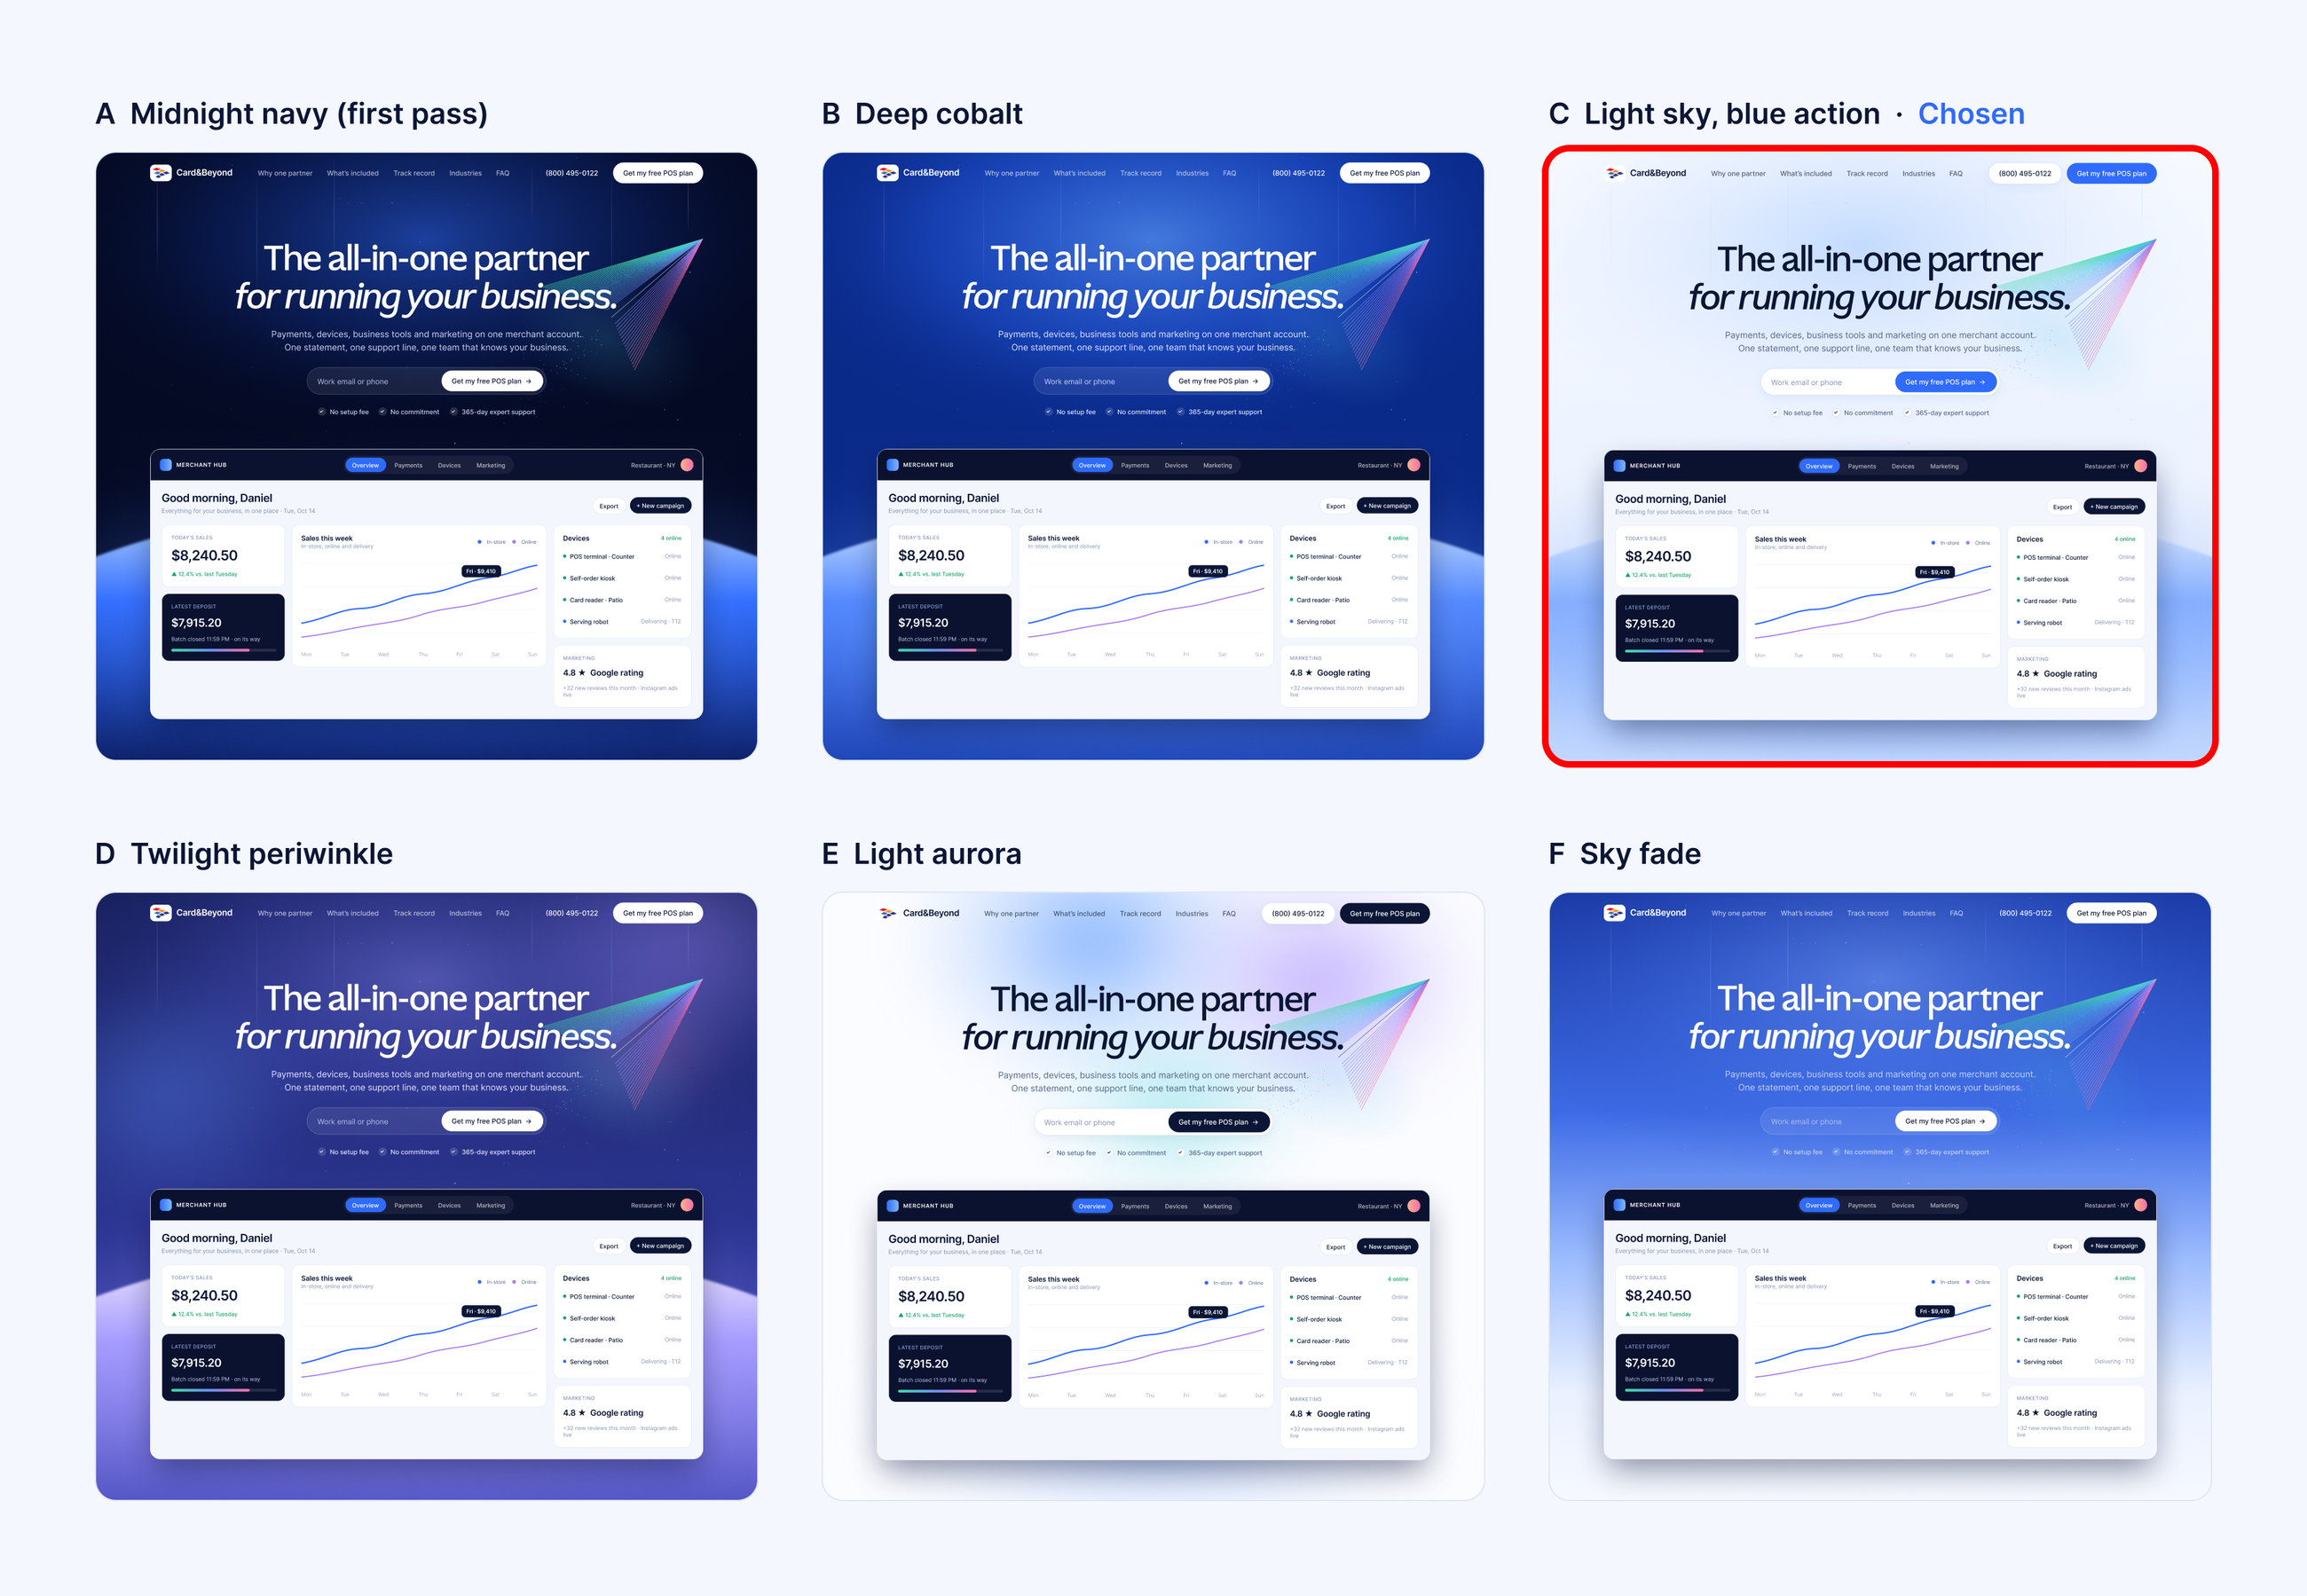
One rule across every page: blue means interactive. Each product has its own accent color, so users recognize it across all five pages.
Scaling the Solution
Scaling the system to one landing page per ad.
With the brand page done, I proposed splitting the campaign by product. Each ad now lands on a page that continues its promise, and all five pages share one structure and one call to action.
Version 1
Version 2
The marketing team ran the ads; I owned the experience after the click. The all-in-one message and the per-product split were my proposals, and they changed how the ads were planned, not just how the pages looked.
Impact
Higher engagement and nearly 4x the inquiry conversion.
Old website → version 2
Inquiry conversion
Bounce rate
Reached the first form
Time on page
Version 1 moved every number in the right direction, but conversion stayed below target. Version 2 is what got it there.
The client was happy with the result! With a page per product, they can now see demand for each one separately.
Reflection
What I'd do differently
Defining the MVP of a 0-to-1 AI marketing platform
Overview
In progress · in staging
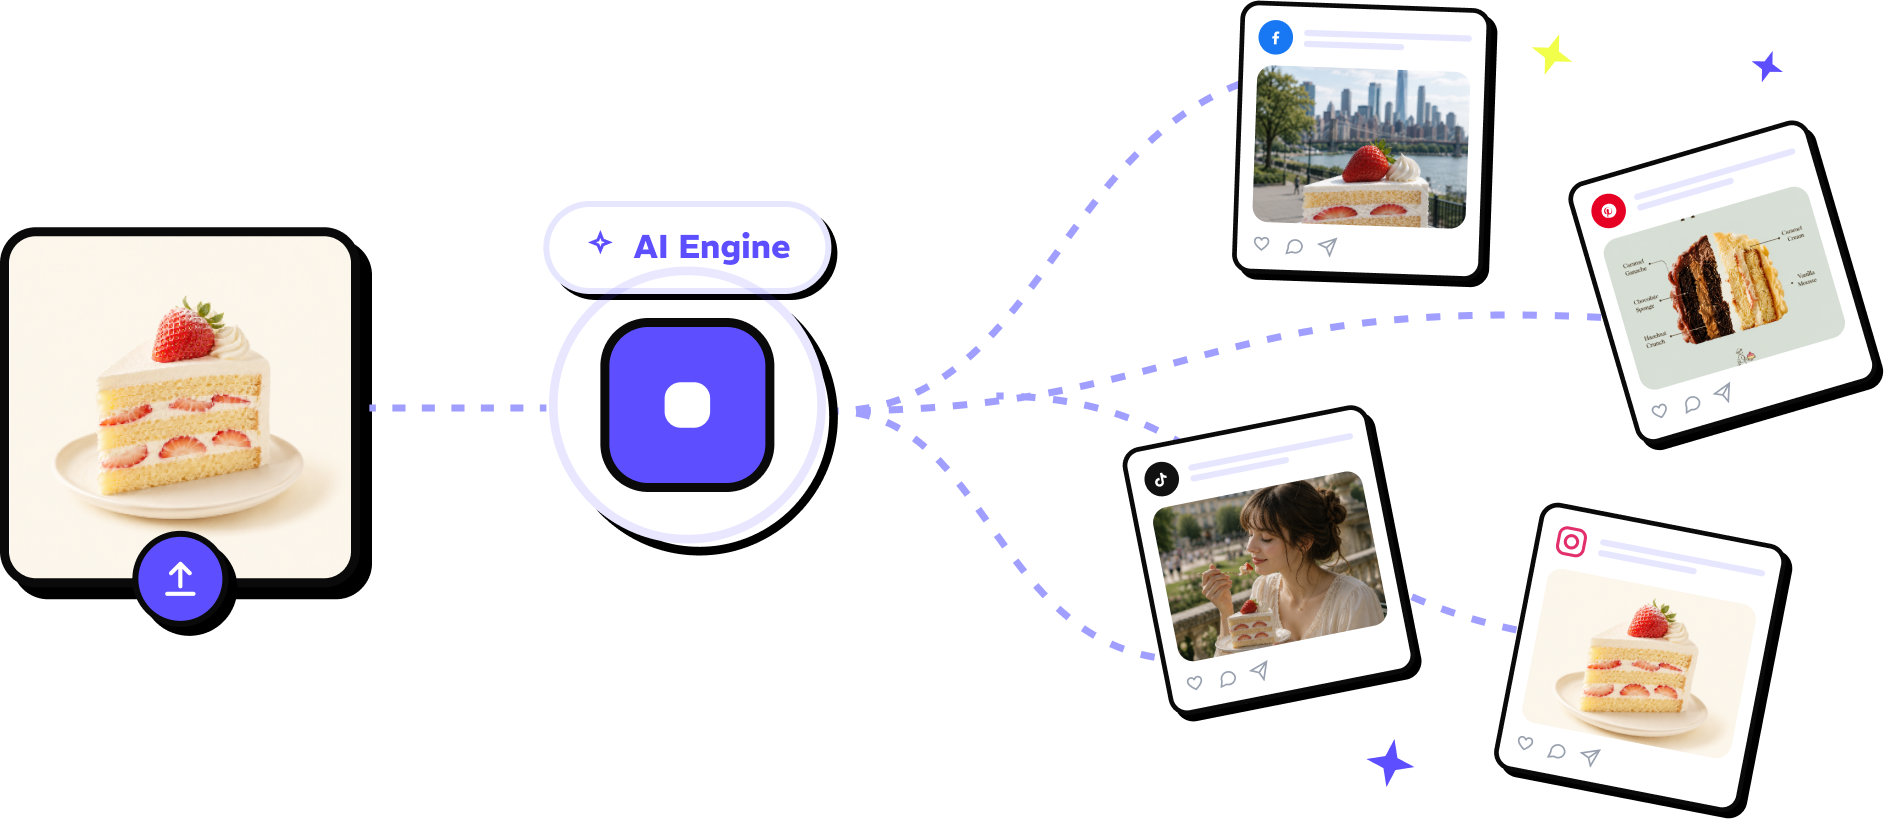
One product photo in, ready-to-post images out.
Olliz is an AI marketing tool for small businesses: upload one product photo, get on-brand posts for every social channel.
The problem
Small businesses need a steady stream of social content but lack the time, budget and design skills. AI tools produce generic content they don't trust.
The goal
Cut the time and cost of social media marketing for small businesses, with AI content they can trust.
What I did
- User research: competitor UX review, recruiting, 5 of 10 interviews
- User journey, flows and early concepts
- End-to-end design of onboarding, scheduling, analytics and billing
- Empty, loading, error and limit states
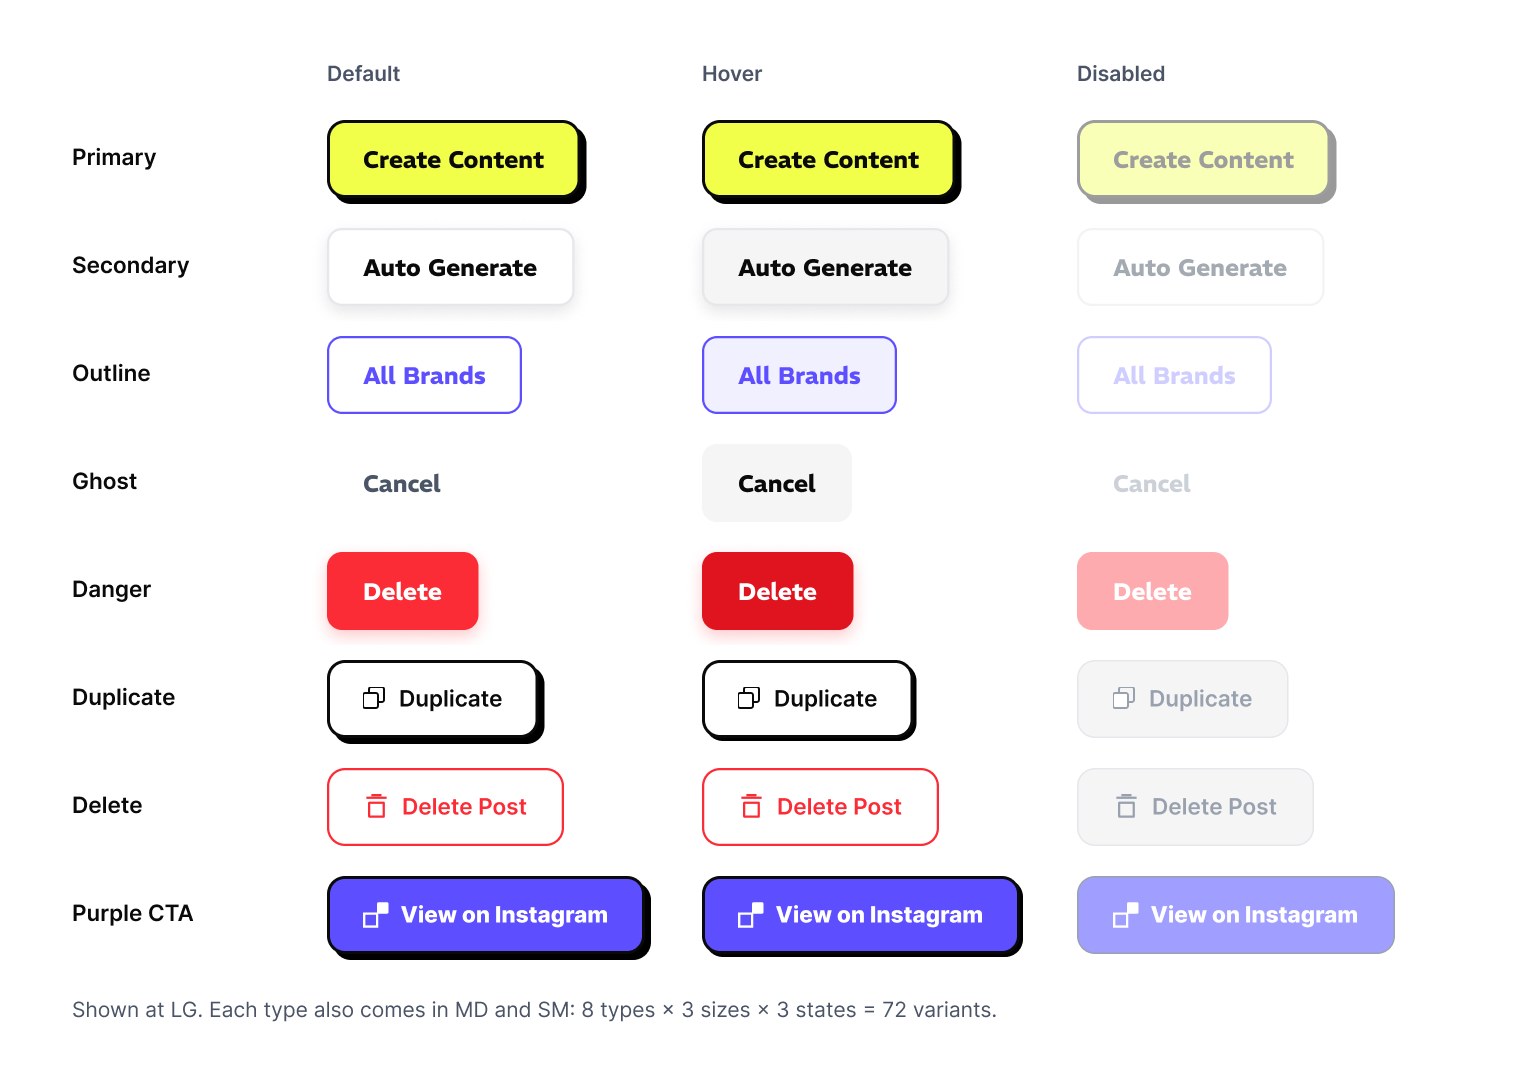
- Component library on the lead's design system
- Landing page and its try-it demo
- AI image quality testing
Design principles
- 01Research-driven prioritization
- 02Reducing onboarding effort
- 03Removing publishing friction
Final Design
Streamlining the user flow from onboarding to publishing.
Latest hi-fi prototype. Still in testing.
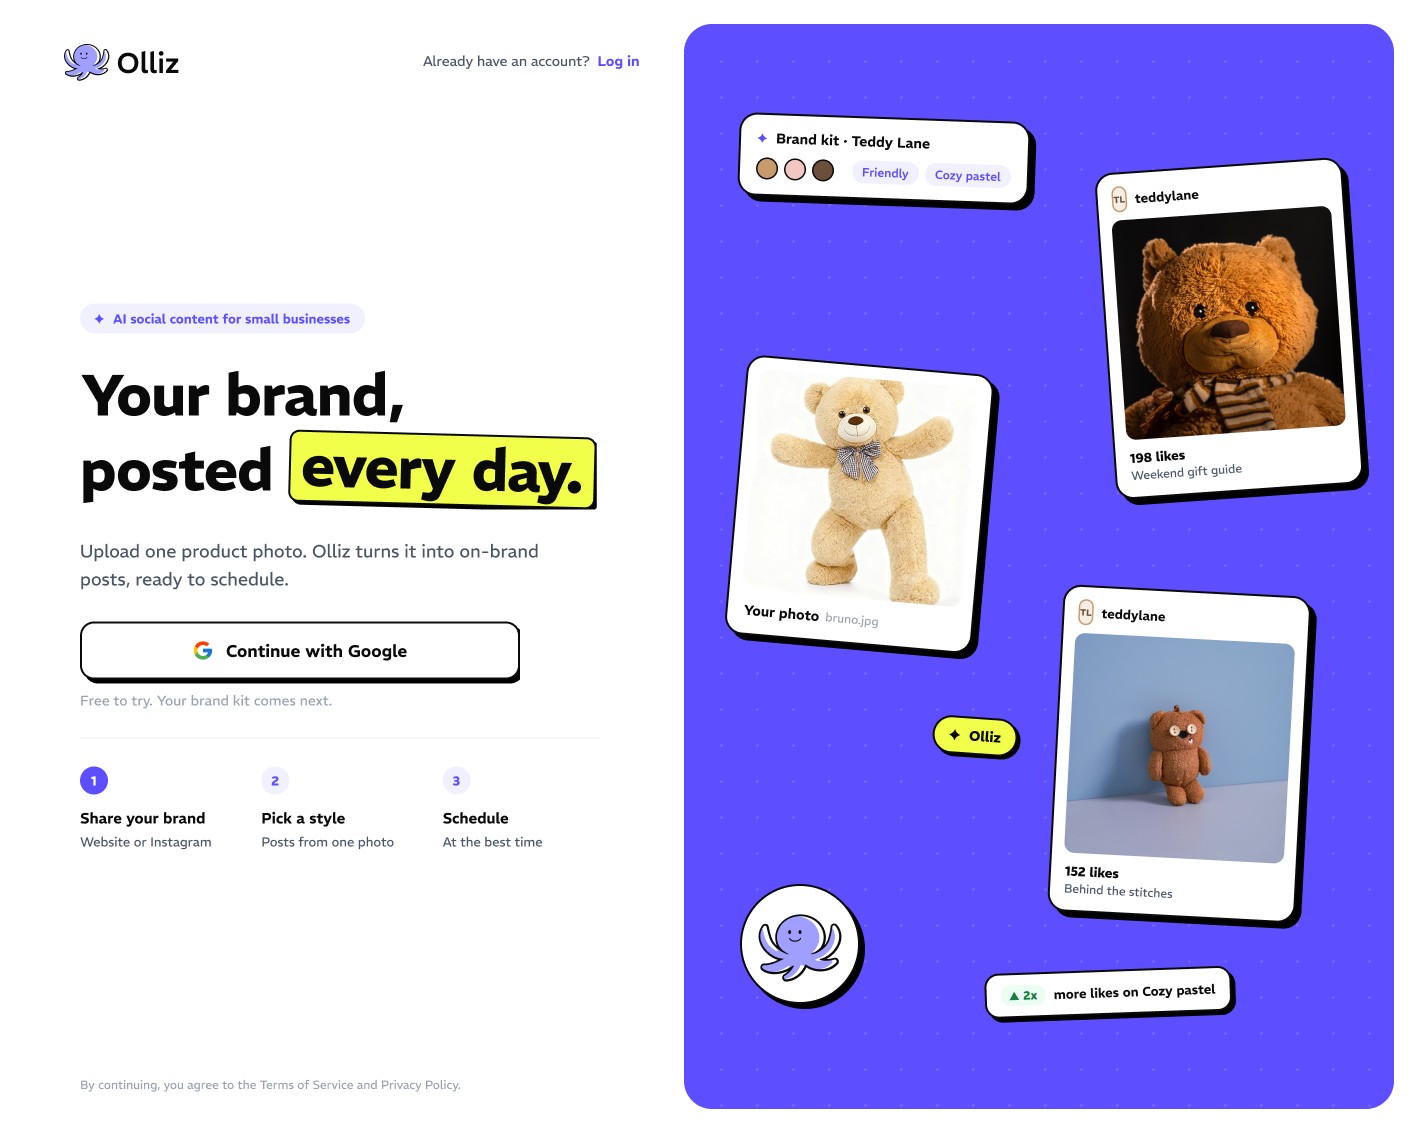
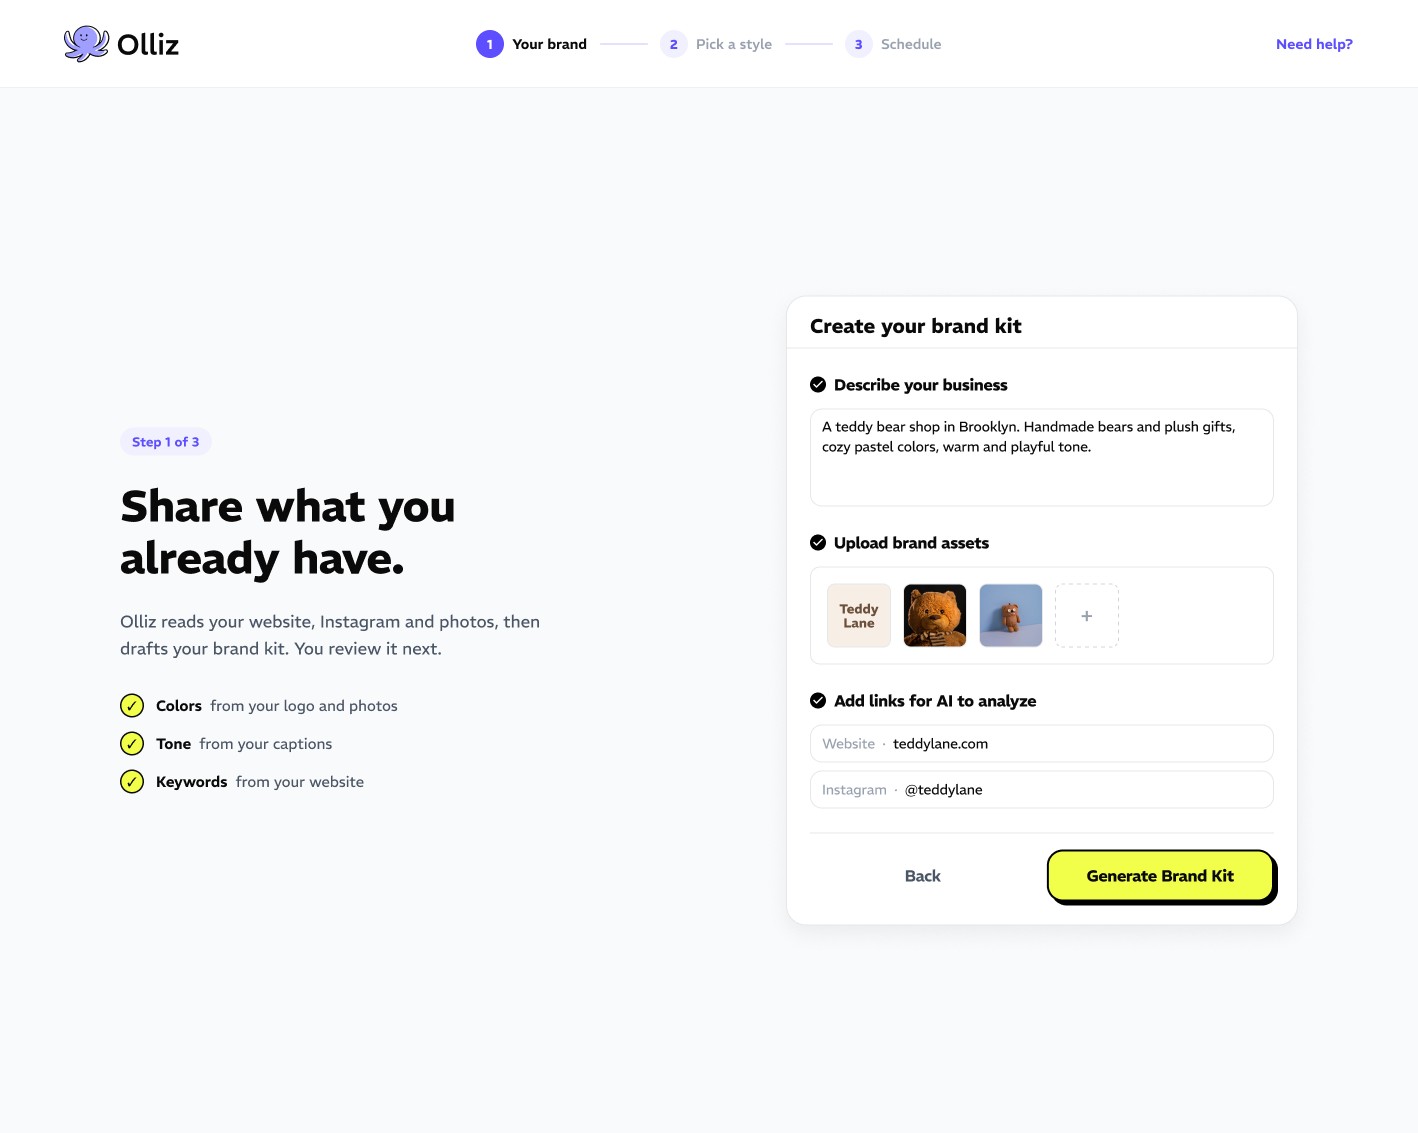
Onboarding. Sign up, then share what you already have.
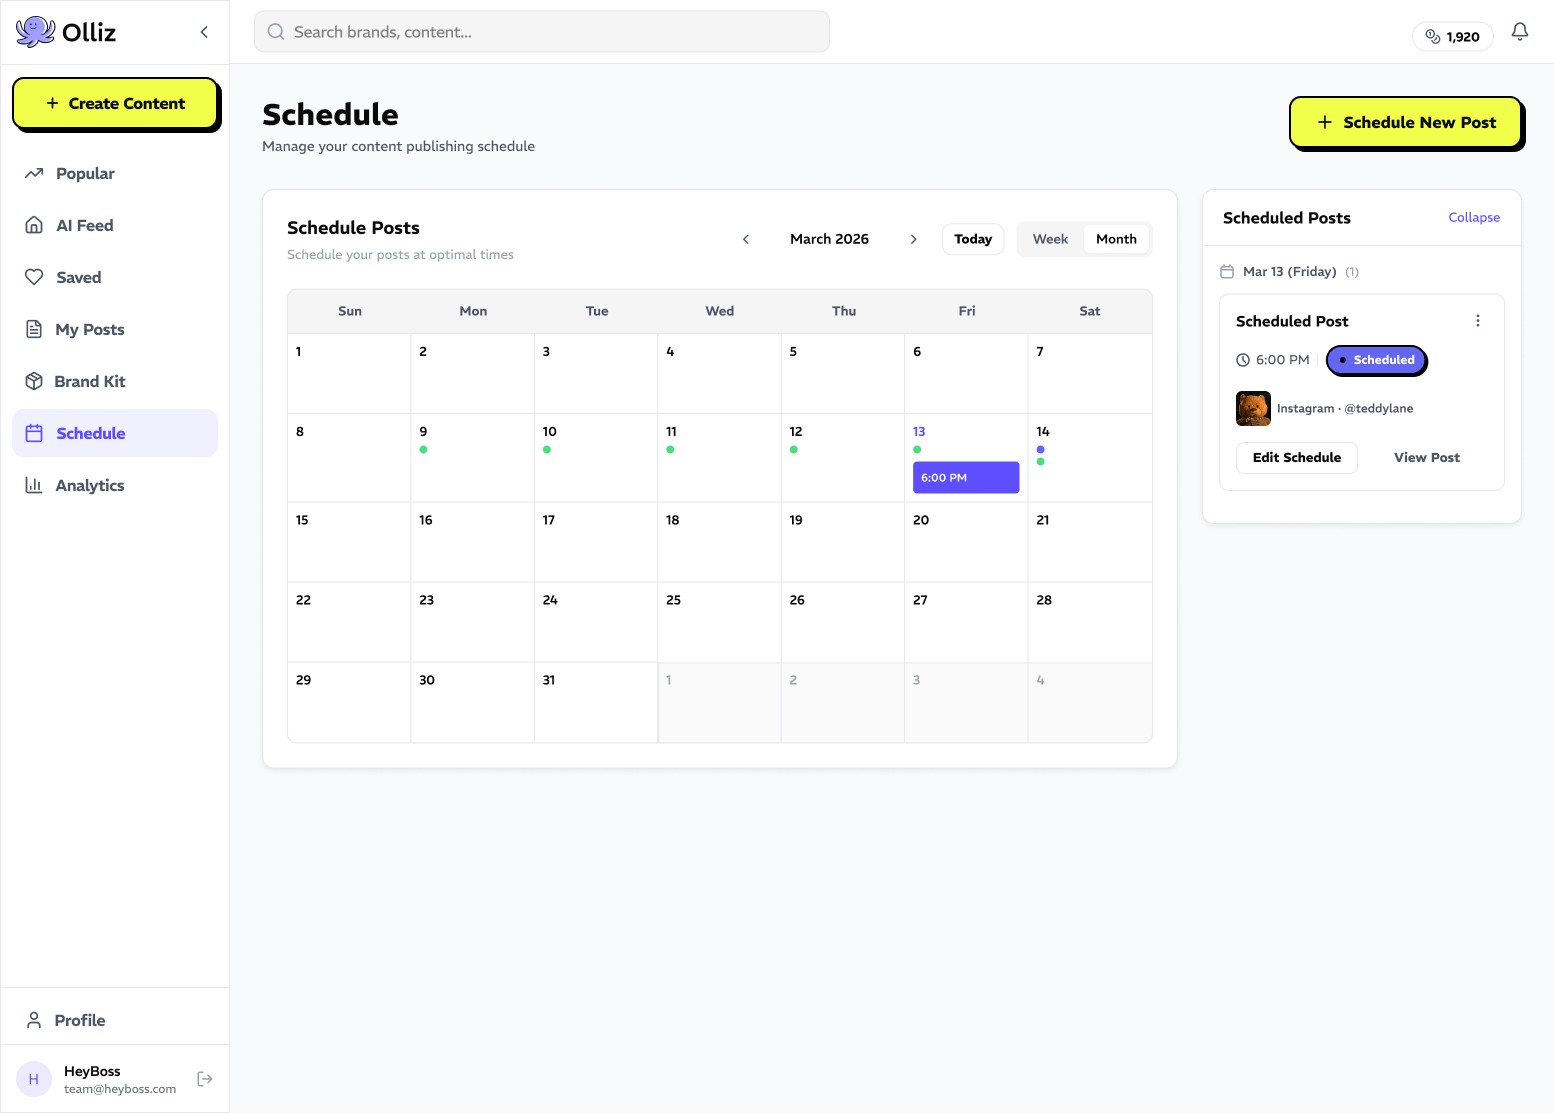
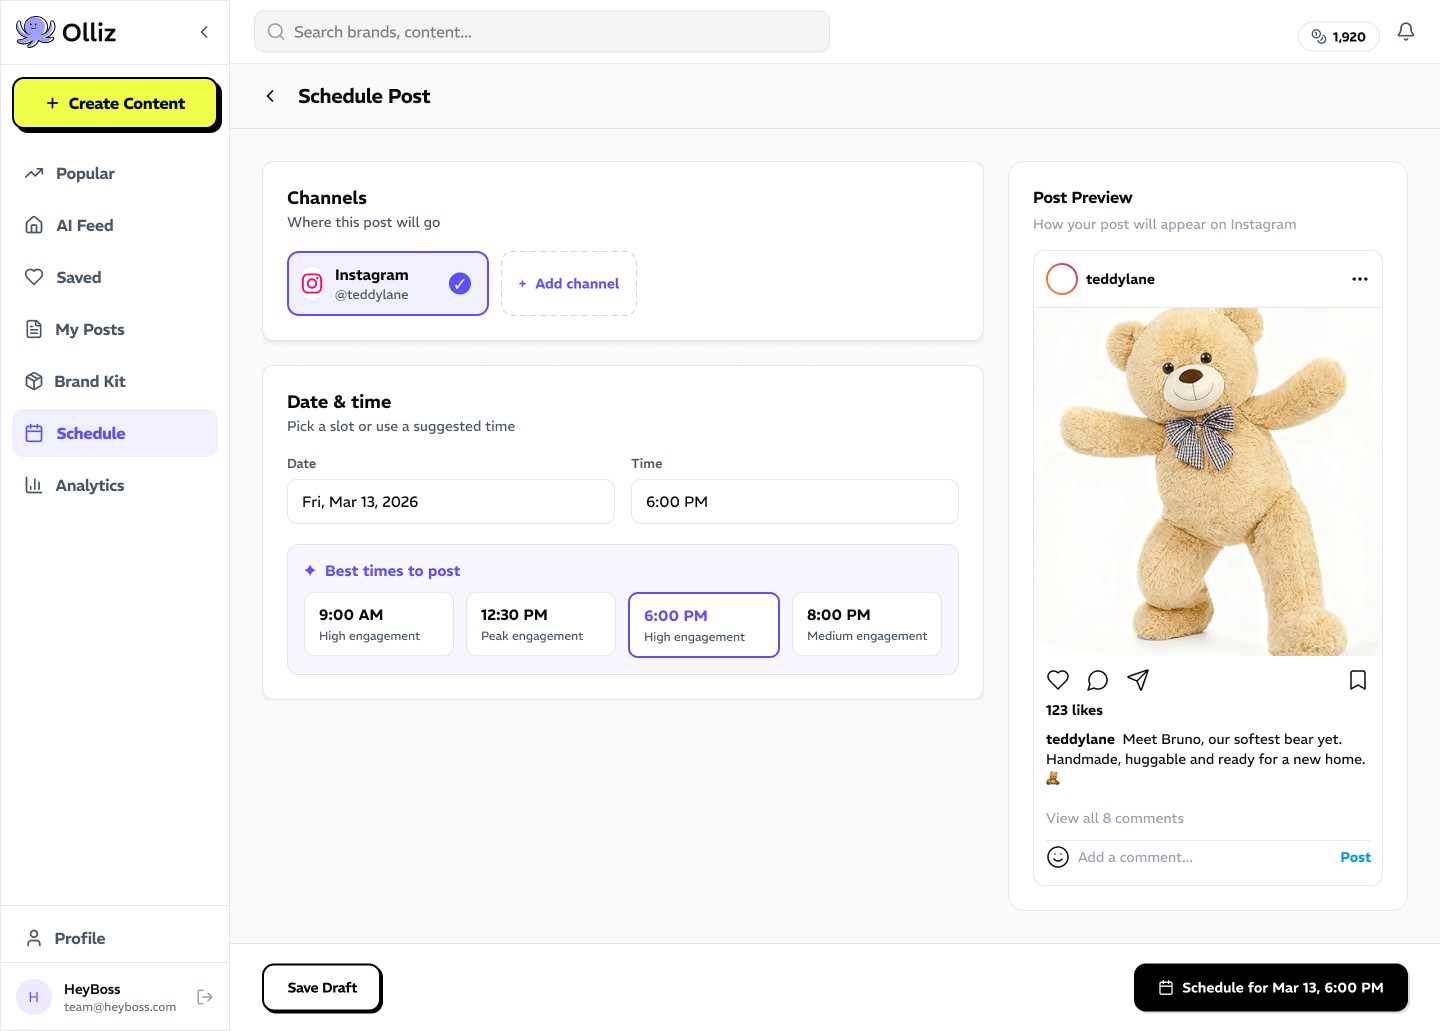
Scheduling. Plan the month and post at the best time.
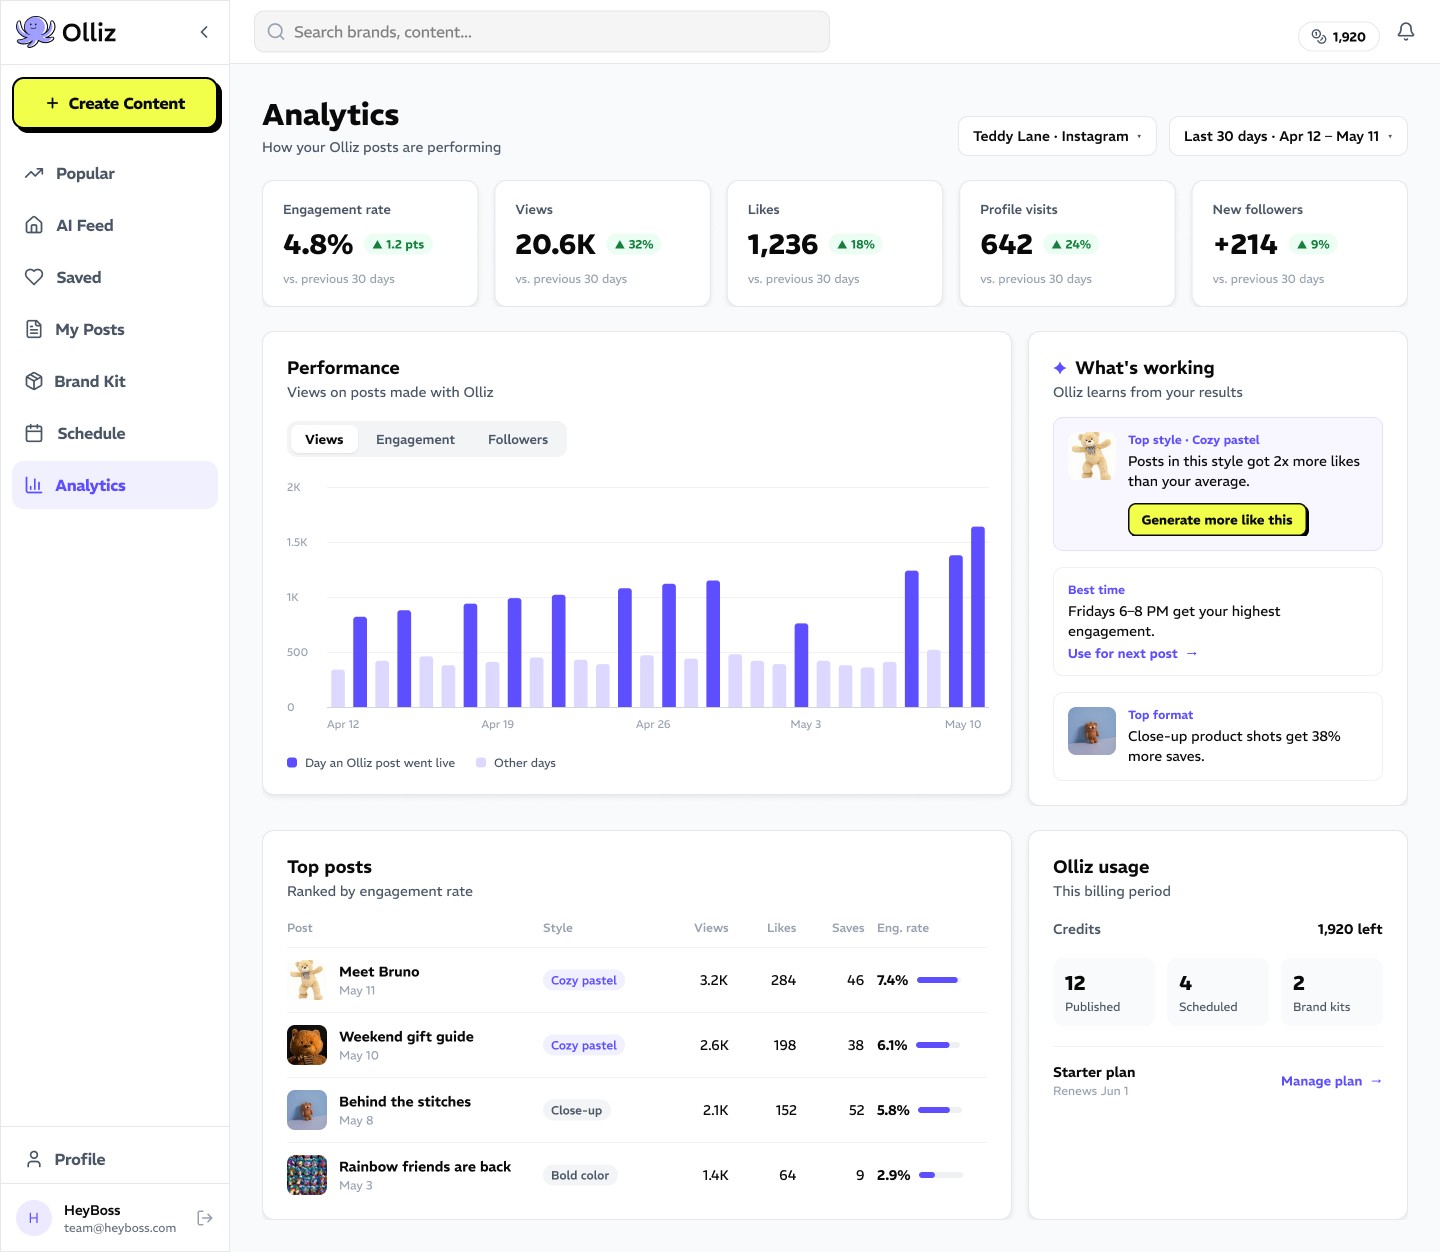
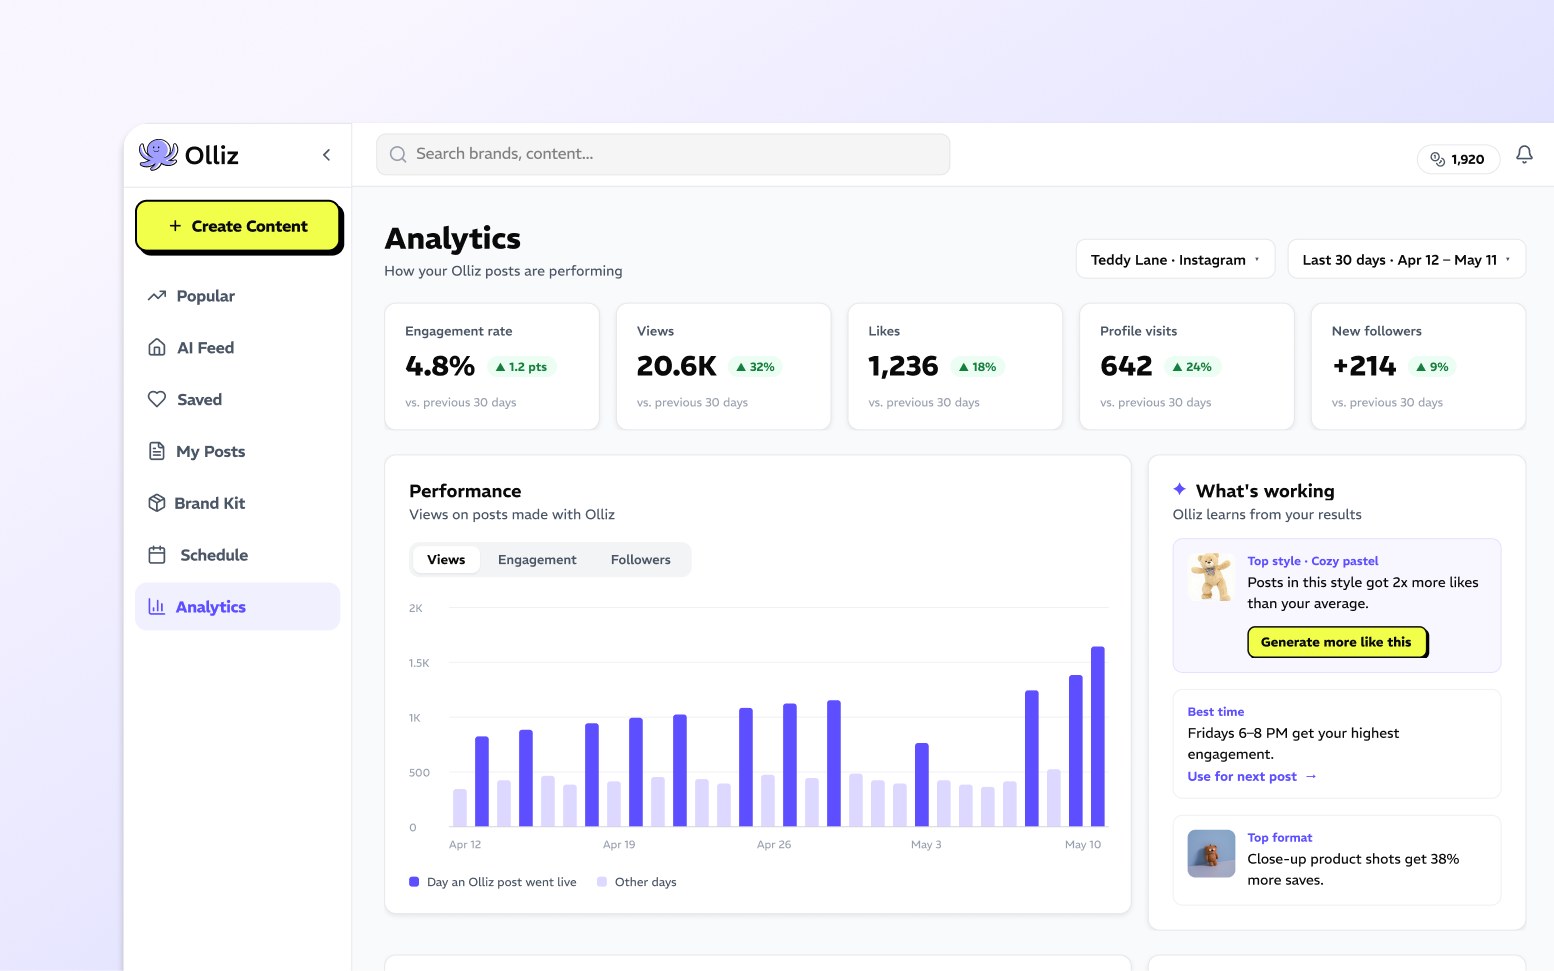
Analytics. See what works and make more of it.
Competitive Analysis
Where do owners still get stuck?
To see where owners still get stuck, I picked ten tools they already pay for and asked each the same seven questions:
| AI drafts | Marketing visuals | Scheduling | Team review | Learns what performs | |
|---|---|---|---|---|---|
| AI-first generators | |||||
| Jasper | |||||
| Copy.ai | |||||
| Writesonic | |||||
| Ocoya | |||||
| Lately | |||||
| Design and scheduling tools | |||||
| Canva | |||||
| VistaCreate | |||||
| Later | |||||
| Buffer | |||||
| Hootsuite | |||||
| The opening | |||||
AI writers couldn't make visuals. Design tools treated AI as an add-on. None learned from results. That gap became the opportunity.
How Olliz could learn what works
User Interviews
Testing assumptions with real users.
Five assumed personas, tested in ten interviews with business owners and marketers.
I recruited participants and ran five of the interviews.
| To learn | We asked | We heard |
|---|---|---|
| Do they want the AI to take over? | "Do you prefer AI to be fully automatic, or do you want to guide it while it creates drafts?" | 5 of 10 wanted to guide it step by step |
| Where does trust break? | "Have you tried existing AI tools like ChatGPT? What's usually missing or frustrating in their drafts?" | 6 of 10 said AI output looks generic or fake; 6 wanted their own brand style |
| How much choice helps? | "How many draft options would feel 'just enough' for you to feel confident, without being overwhelming?" | 4 of 10 asked for several drafts. The right number stayed open |
| Does editing and scheduling belong here? | "After AI drafts are generated, how important is it to edit and schedule posts in the same tool?" | 4 of 10 valued editing in the tool, but it ranked below drafts and brand fit |
| Will they pay? | "Would you pay for this feature, and at what price range?" | 3 named cost as a barrier |
Synthesis
Behavior, not job title, defined the user.
Grouping people by how they create content showed who to build for first.
Hypothesis · 5
Small business ownerIn-house marketerFreelance marketerAgencyEnterprise teamWhat we heard · 3
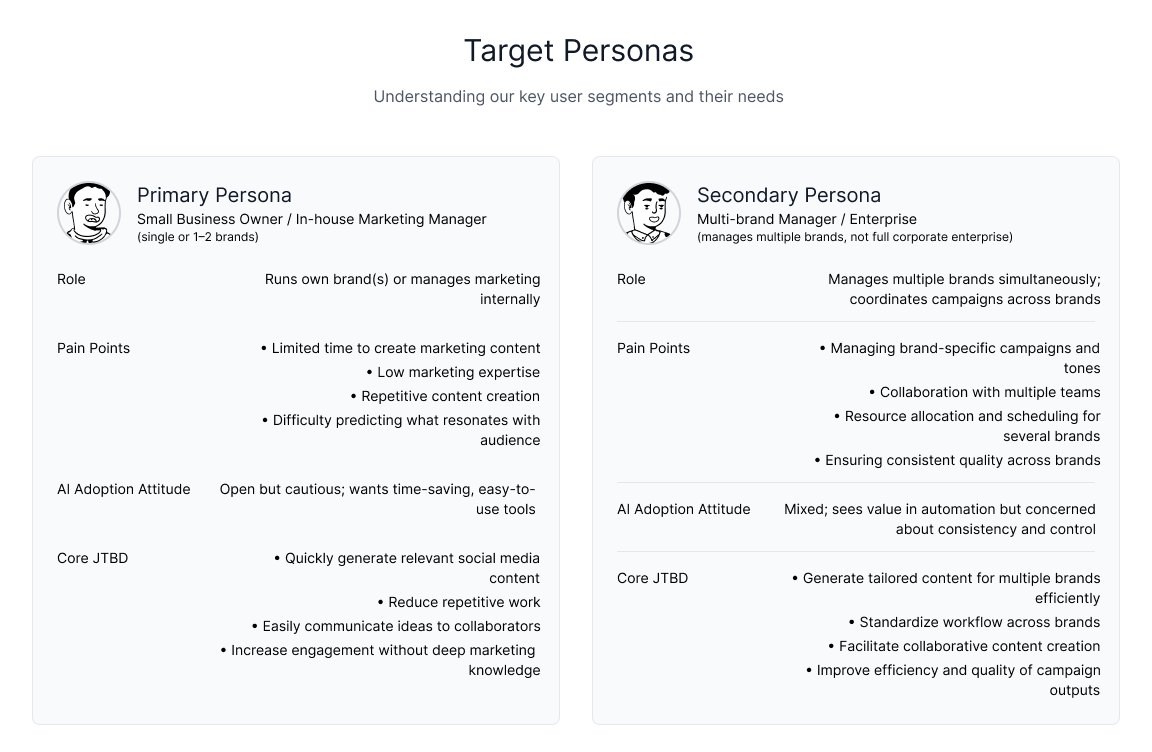
Hands-on creators 5 interviewsTechnical and supporting roles 3Multi-brand teams 2Build for · 2
Primary Owner or in-house marketer, 1–2 brandsSecondary Multi-brand managerThey want to approve, not create.
Control and brand consistency mattered more than full automation. Trust in AI output became the core product problem.
MVP · High
- Guided, step-by-step drafts
- Several editable drafts
- Brand and style alignment
Medium
- Editing captions and images
- Simple scheduling
Later
- Team and client feedback
- Channels beyond social
Product Priorities
From user insights to MVP features.
5 of 10
Want control over the outcome
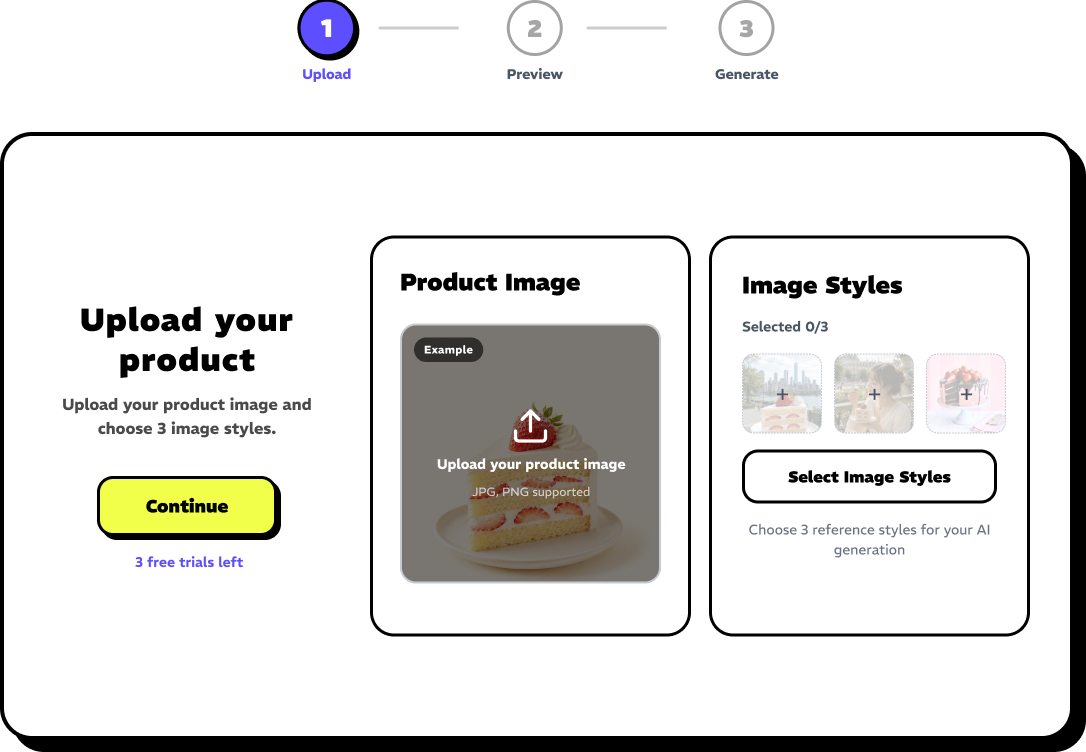
Guided creation
Upload, preview, generate.
4 of 10
Want options, not a single result
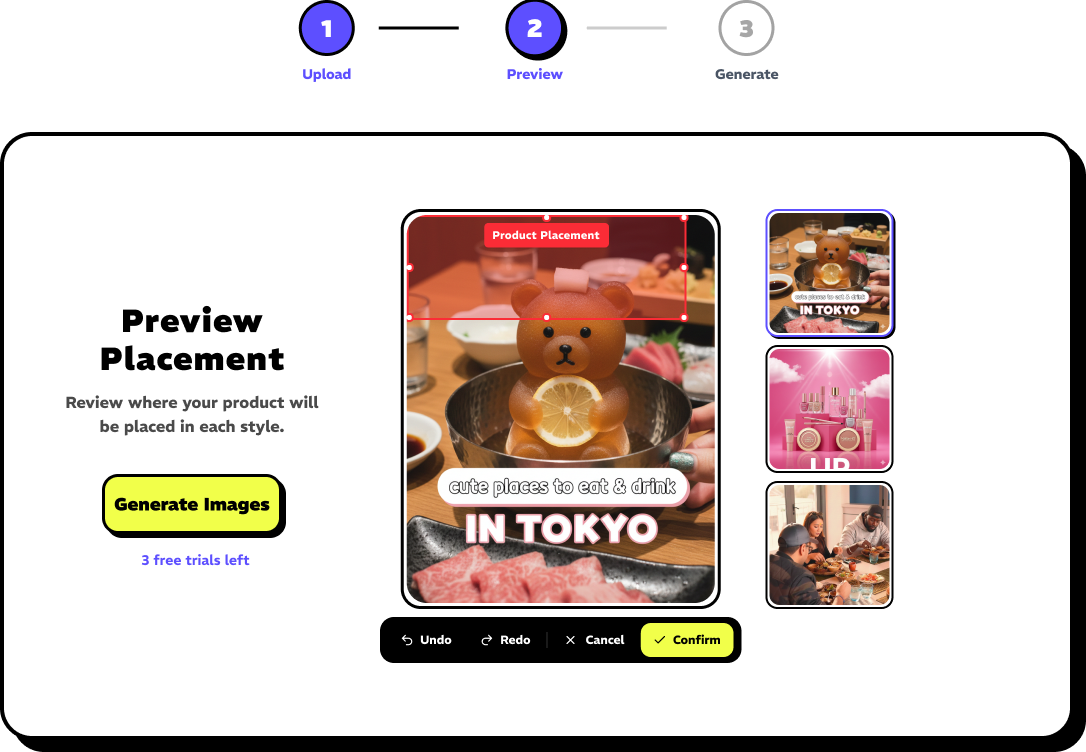
Multiple posts from one photo
Pick 3 styles, get 3 posts.
6 of 10
Want content that matches their brand
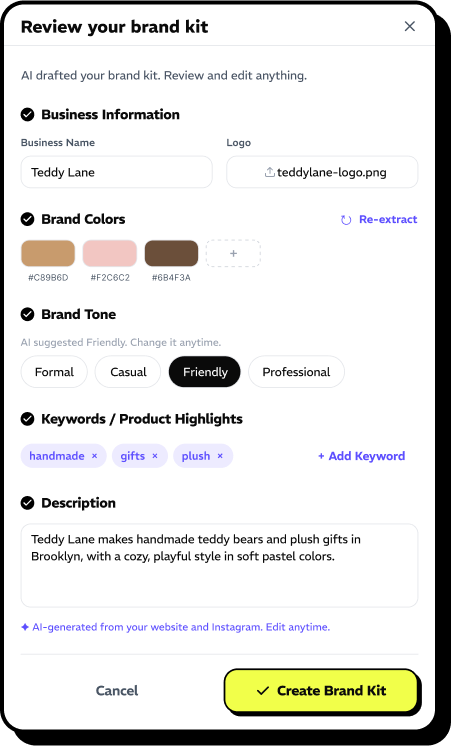
Brand Kit
Colors, tone and keywords applied to every post.
Most interviews
Short on time and ideas
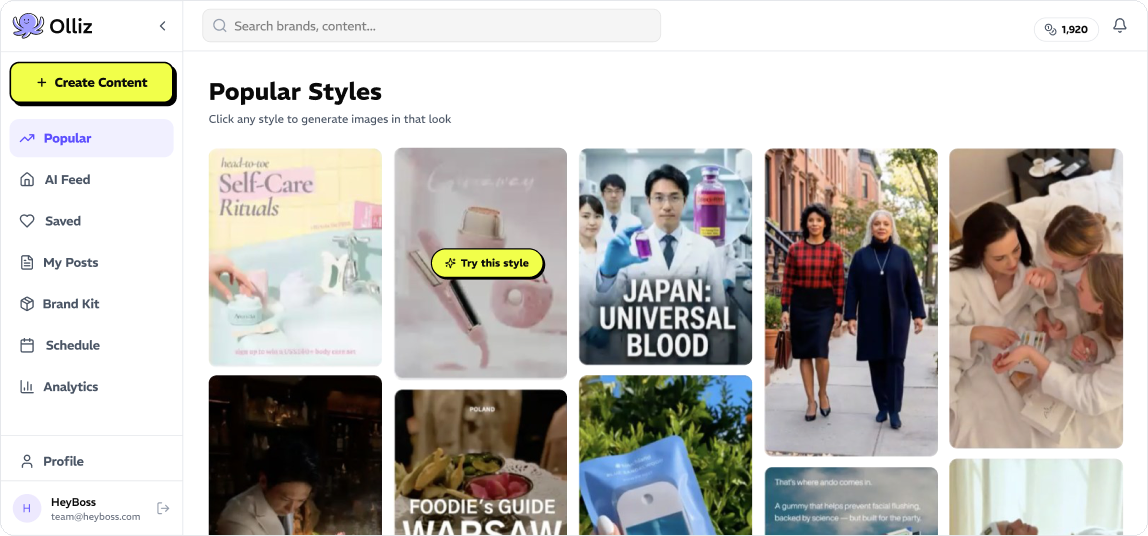
Popular styles and a daily AI feed
Always a place to start.
4 of 10
Want one place to edit and publish
Edit, preview and schedule in one place
Nothing posts without approval.
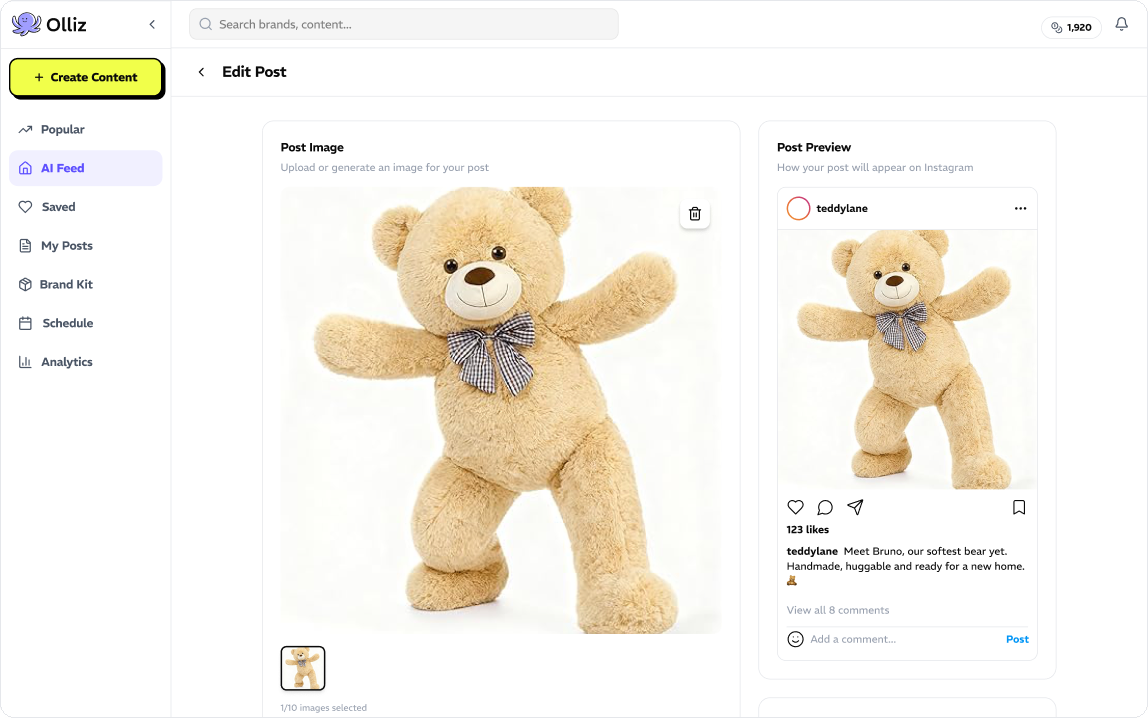
3 of 10
Price-sensitive, want to try first
Free trials before paying
Try it before spending anything.
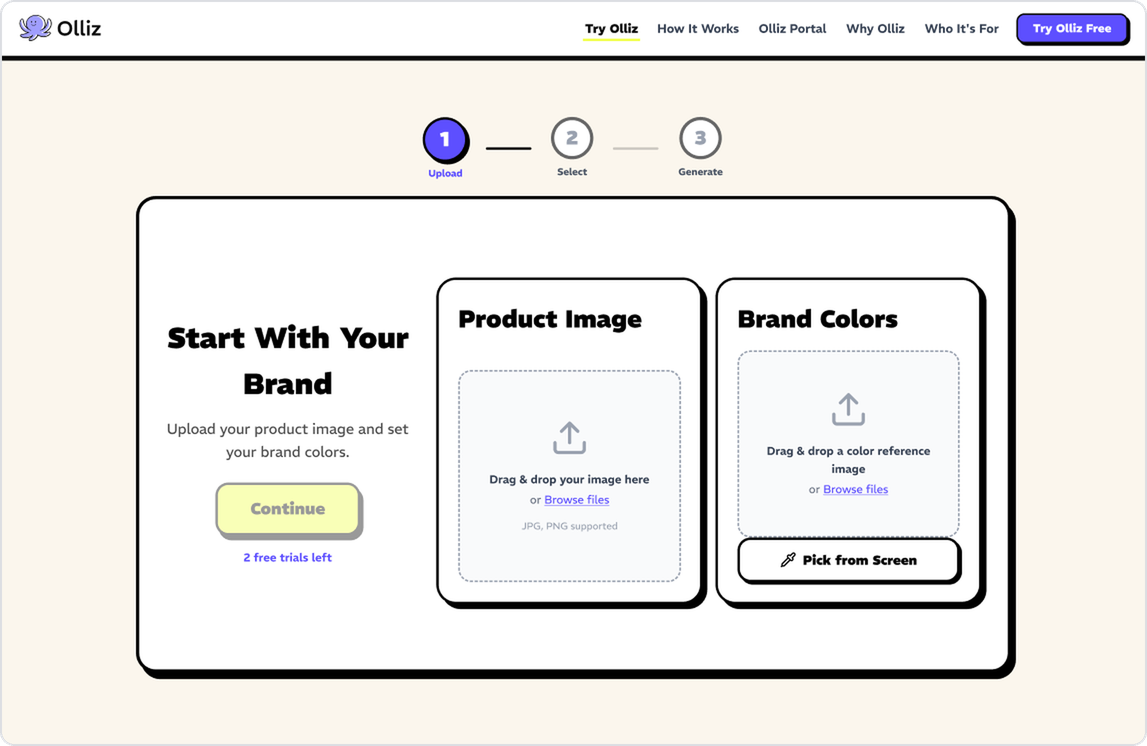
Screens from the Olliz staging site and portal designs.
User Flows
Closing the loop, from creation to results.
The journey map showed three pain points: finding ideas, making visuals that look professional, and writing captions.
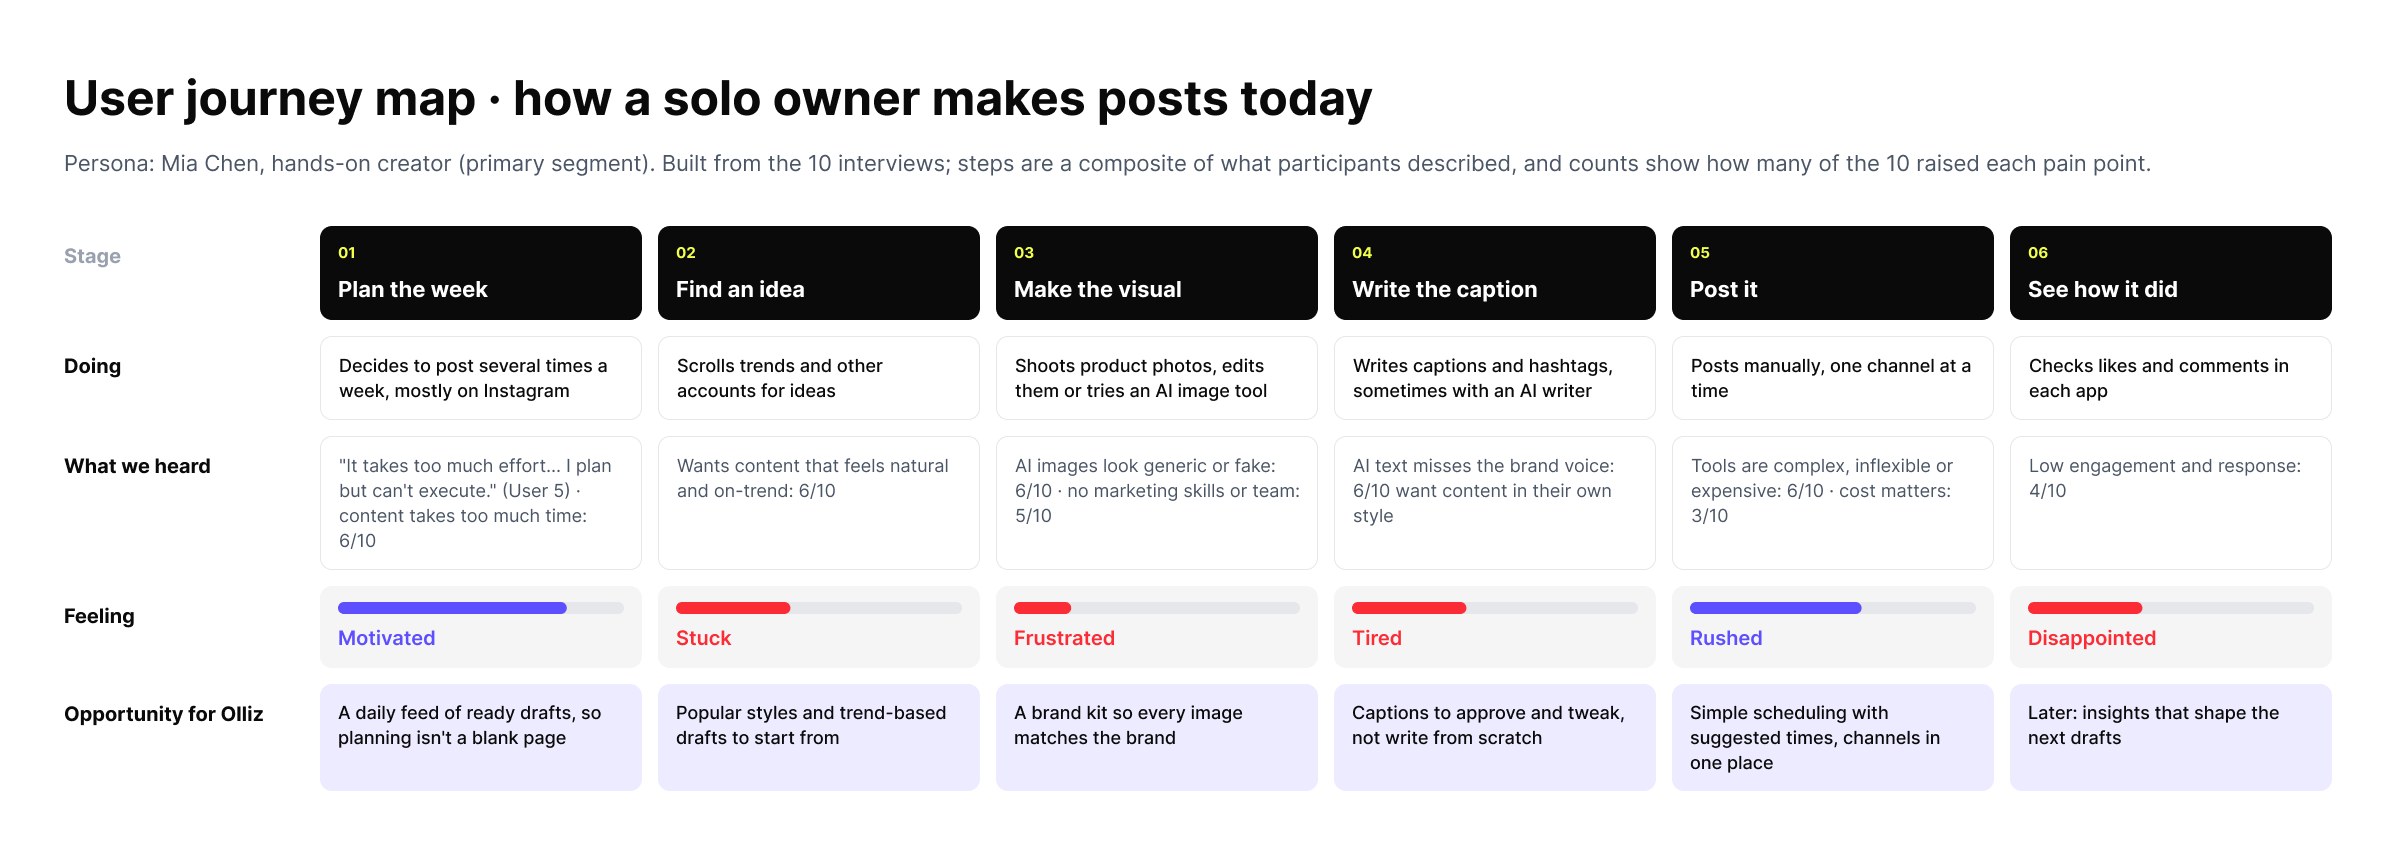
Business details became a first-time step, and a Review step closes the loop most tools leave open.
Concept sketches were tested with interviewees before our lead chose a direction.
Design System
A scalable component system.
Built on the lead's foundations: tokens, text and effect styles, and components that support Light and Dark modes.
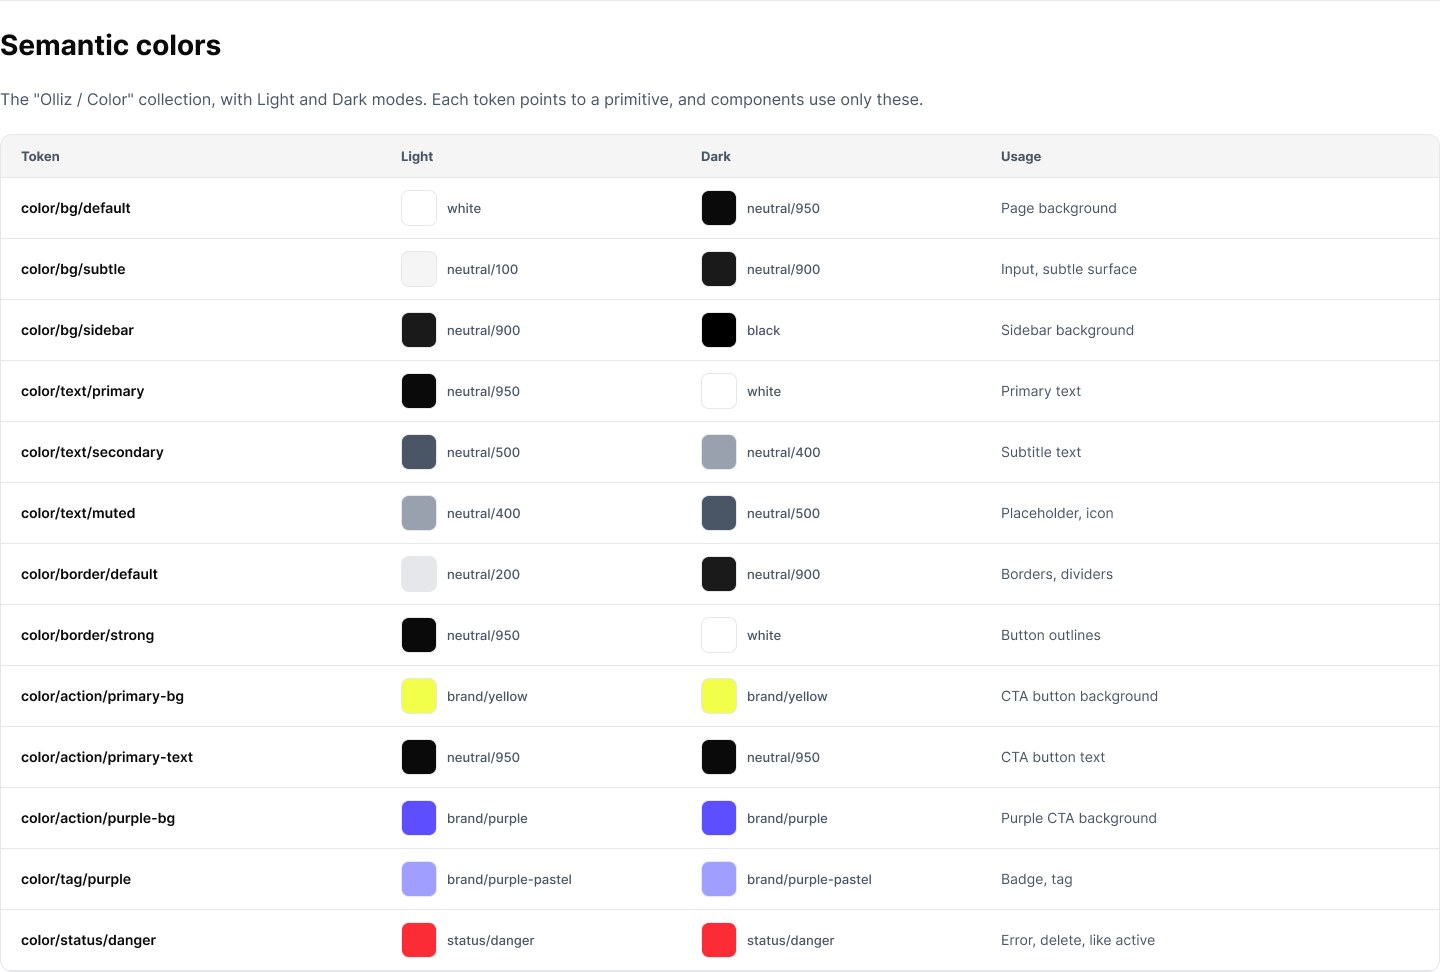
Decision 01 · Onboarding
Reducing onboarding friction while keeping every post on-brand.
What people need
On-brand posts. 6 of 10 asked for it first.
The catch
Owners have no time for long setup forms.
The obvious way
A long form, typed by hand.
The approach
Share what already exists, like a website, Instagram or logo. AI drafts the brand profile for review.
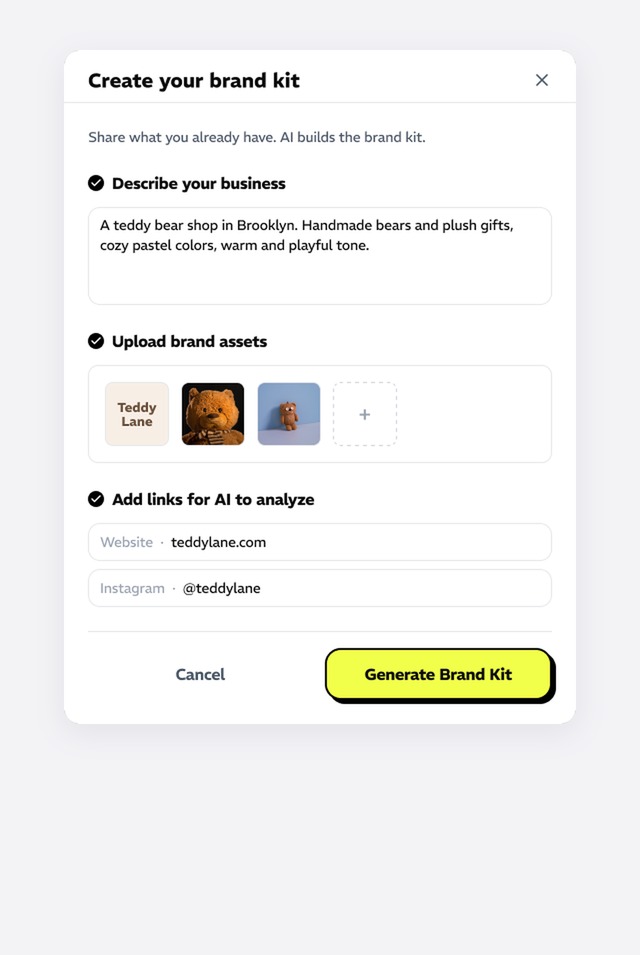
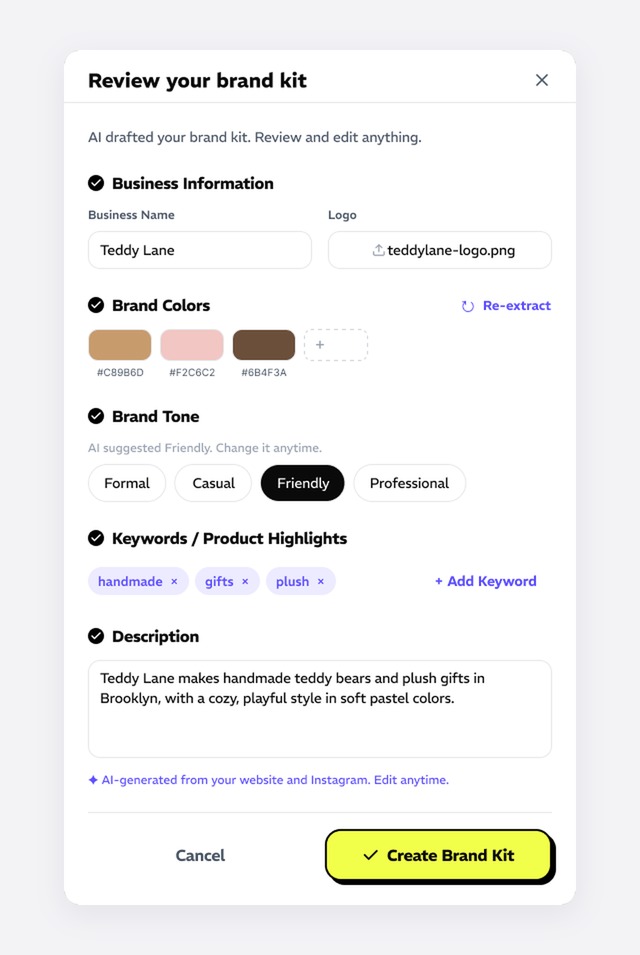
Usability testing
The form felt long. Users preferred to try a ready-made popular style first and see a result.
Next iteration
Let users start with a popular style and get an image first. Ask for the brand kit later, with AI filling it in.
Decision 02 · Scheduling
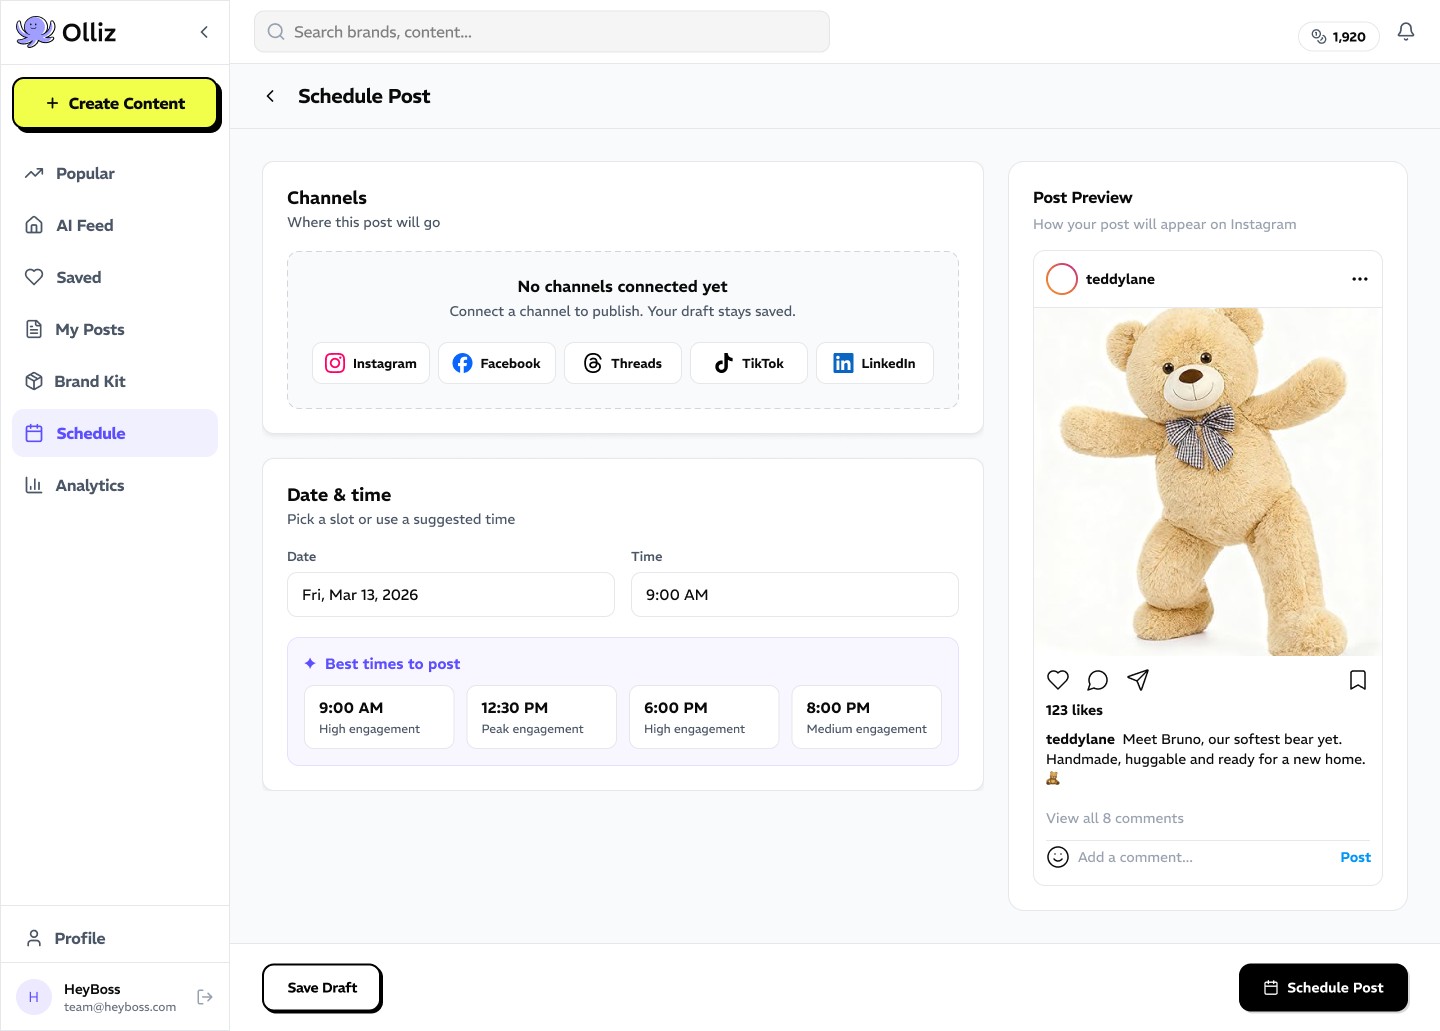
Simplifying publishing so drafts actually get posted.
What people need
Posts that actually go out.
The catch
Only 4 of 10 wanted scheduling here. A full social media manager was the wrong bet.
Decision 03 · Analytics
Prioritizing the analytics users actually need.
Instagram already shows likes. It doesn't show which Olliz posts worked or what to make next.
So results feed the next post, and credits and plan status stay in view, as testing asked.
Testing & Next Steps
In progress · in staging
In testing. Not launched yet.
Done
Research
10 interviews, 10 competitor tools
Done
Wireframes and design system
Onboarding, scheduling, analytics, billing
Done
Hi-fi prototypes
Desktop and mobile
Now
Usability testing
Sessions on the hi-fi prototype
AI output quality
Testing the images the AI makes
Next
Beta and launch
Fixes and handoff, then beta
Usability testing, led by our lead, is shaping the next round: template-first onboarding, AI-assisted brand setup, usage analytics and clearer navigation.
Success metrics
Set by our PM.
Scaling delivery with a multi-brand design system
Overview
Every client site build started from scratch, even though most of it was the same.
HeyBoss designs and builds custom websites for small businesses. A one-page site took about six days, and clients were coming in faster than two engineers could build.
The problem
Every site was designed and coded from zero, though the same sections repeated across clients. Engineering time grew one-for-one with every new client.
The goal
Ship custom client sites faster and take on more clients, without hiring.
What I did
- Audit of past client sites to find repeating sections
- Figma components with layout variants
- Component properties that adapt one section to any brand
- Design QA on every coded component
- A new workflow: designers assemble sites, engineers review
Design principles
- 01Reuse over rebuild
- 02Configurable, not custom
- 03Consistency at scale
Final Design
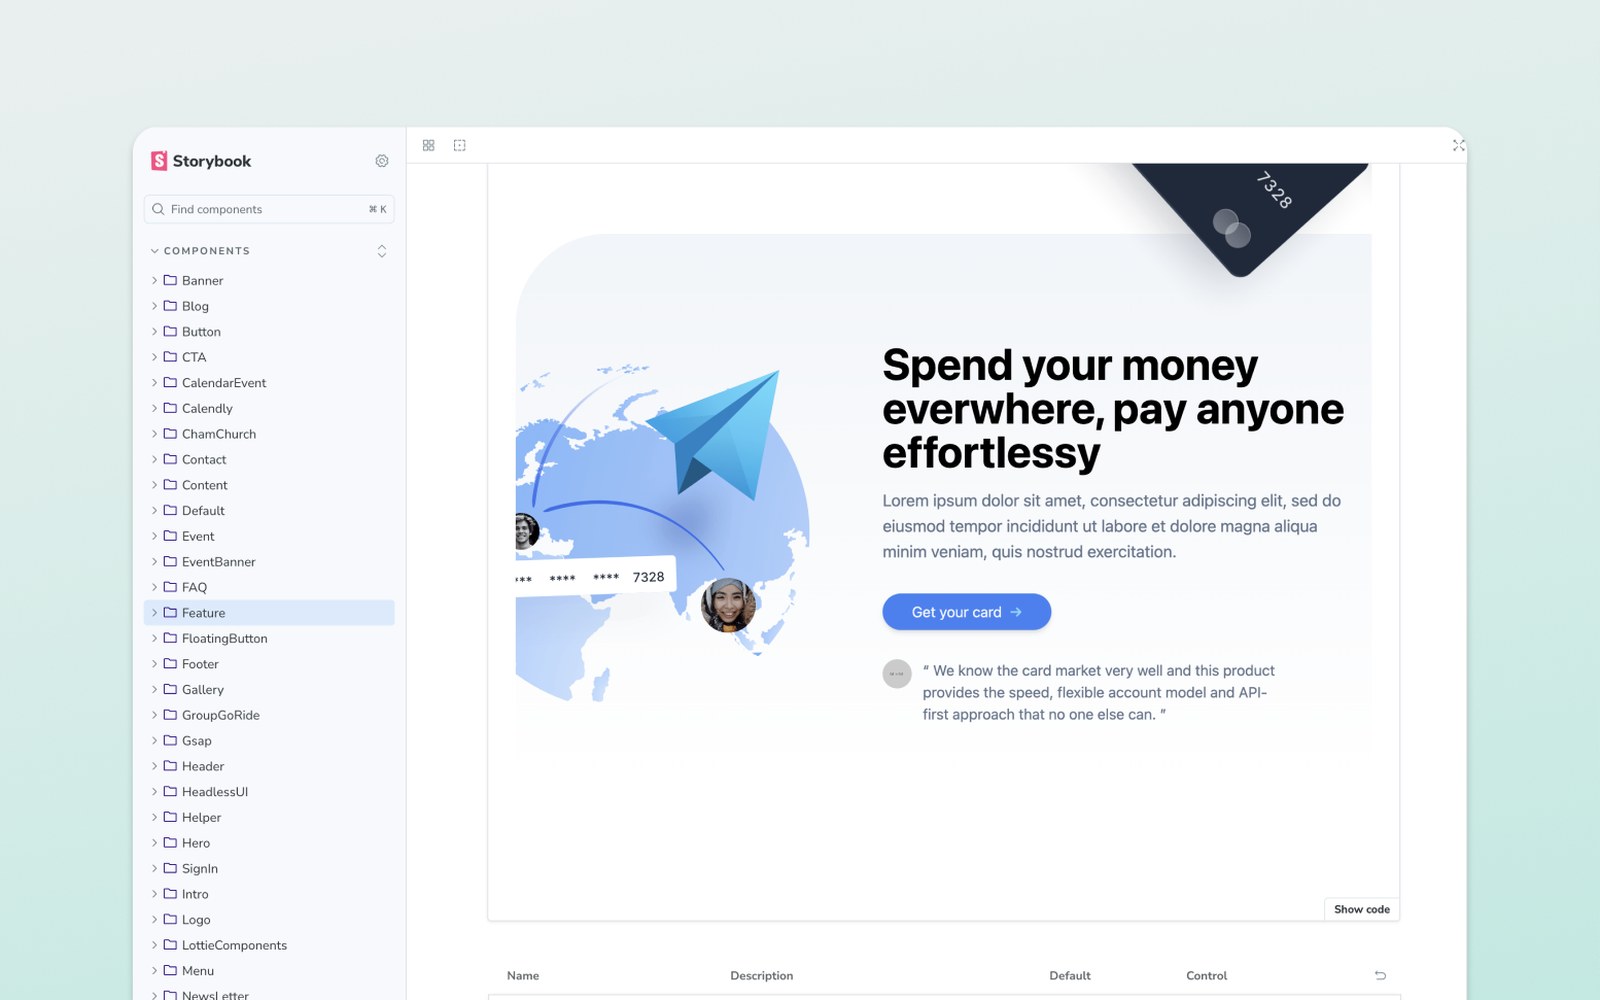
Context & Problem
Every build started from zero, so cost grew with every client.
Nothing was reused between clients, so engineering time scaled one-to-one with client volume.
Key Insight
The same sections repeated, with only the styling changing.
An audit of past sites showed the same sections again and again. Only fonts, colors, images and copy changed, which component properties can handle.
Exploring Options
Evaluating three ways to scale.
System Design
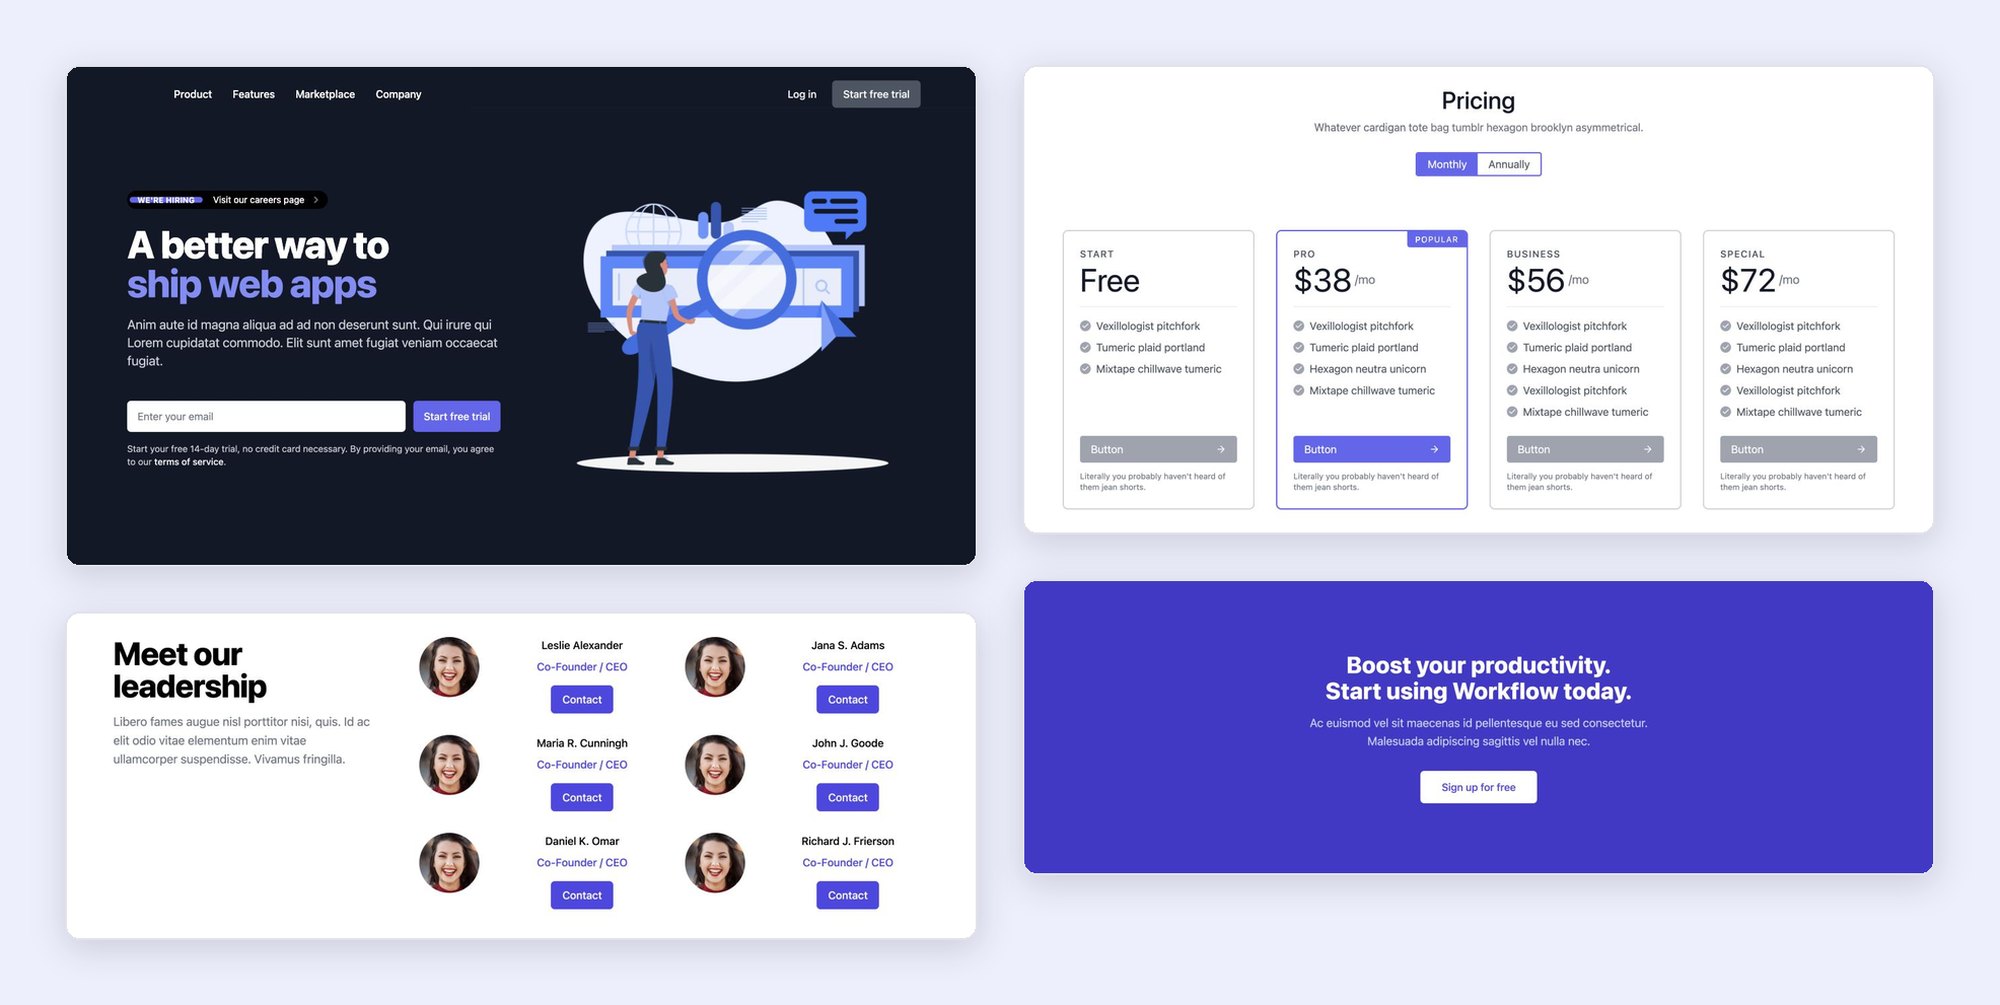
Layout as variants, styling as properties.
- I started from sections we'd already shipped, so the first set came from real demand.
- Each layout is a variant. Hero alone has 24.
- Mobile and desktop get their own values, set as paired properties.
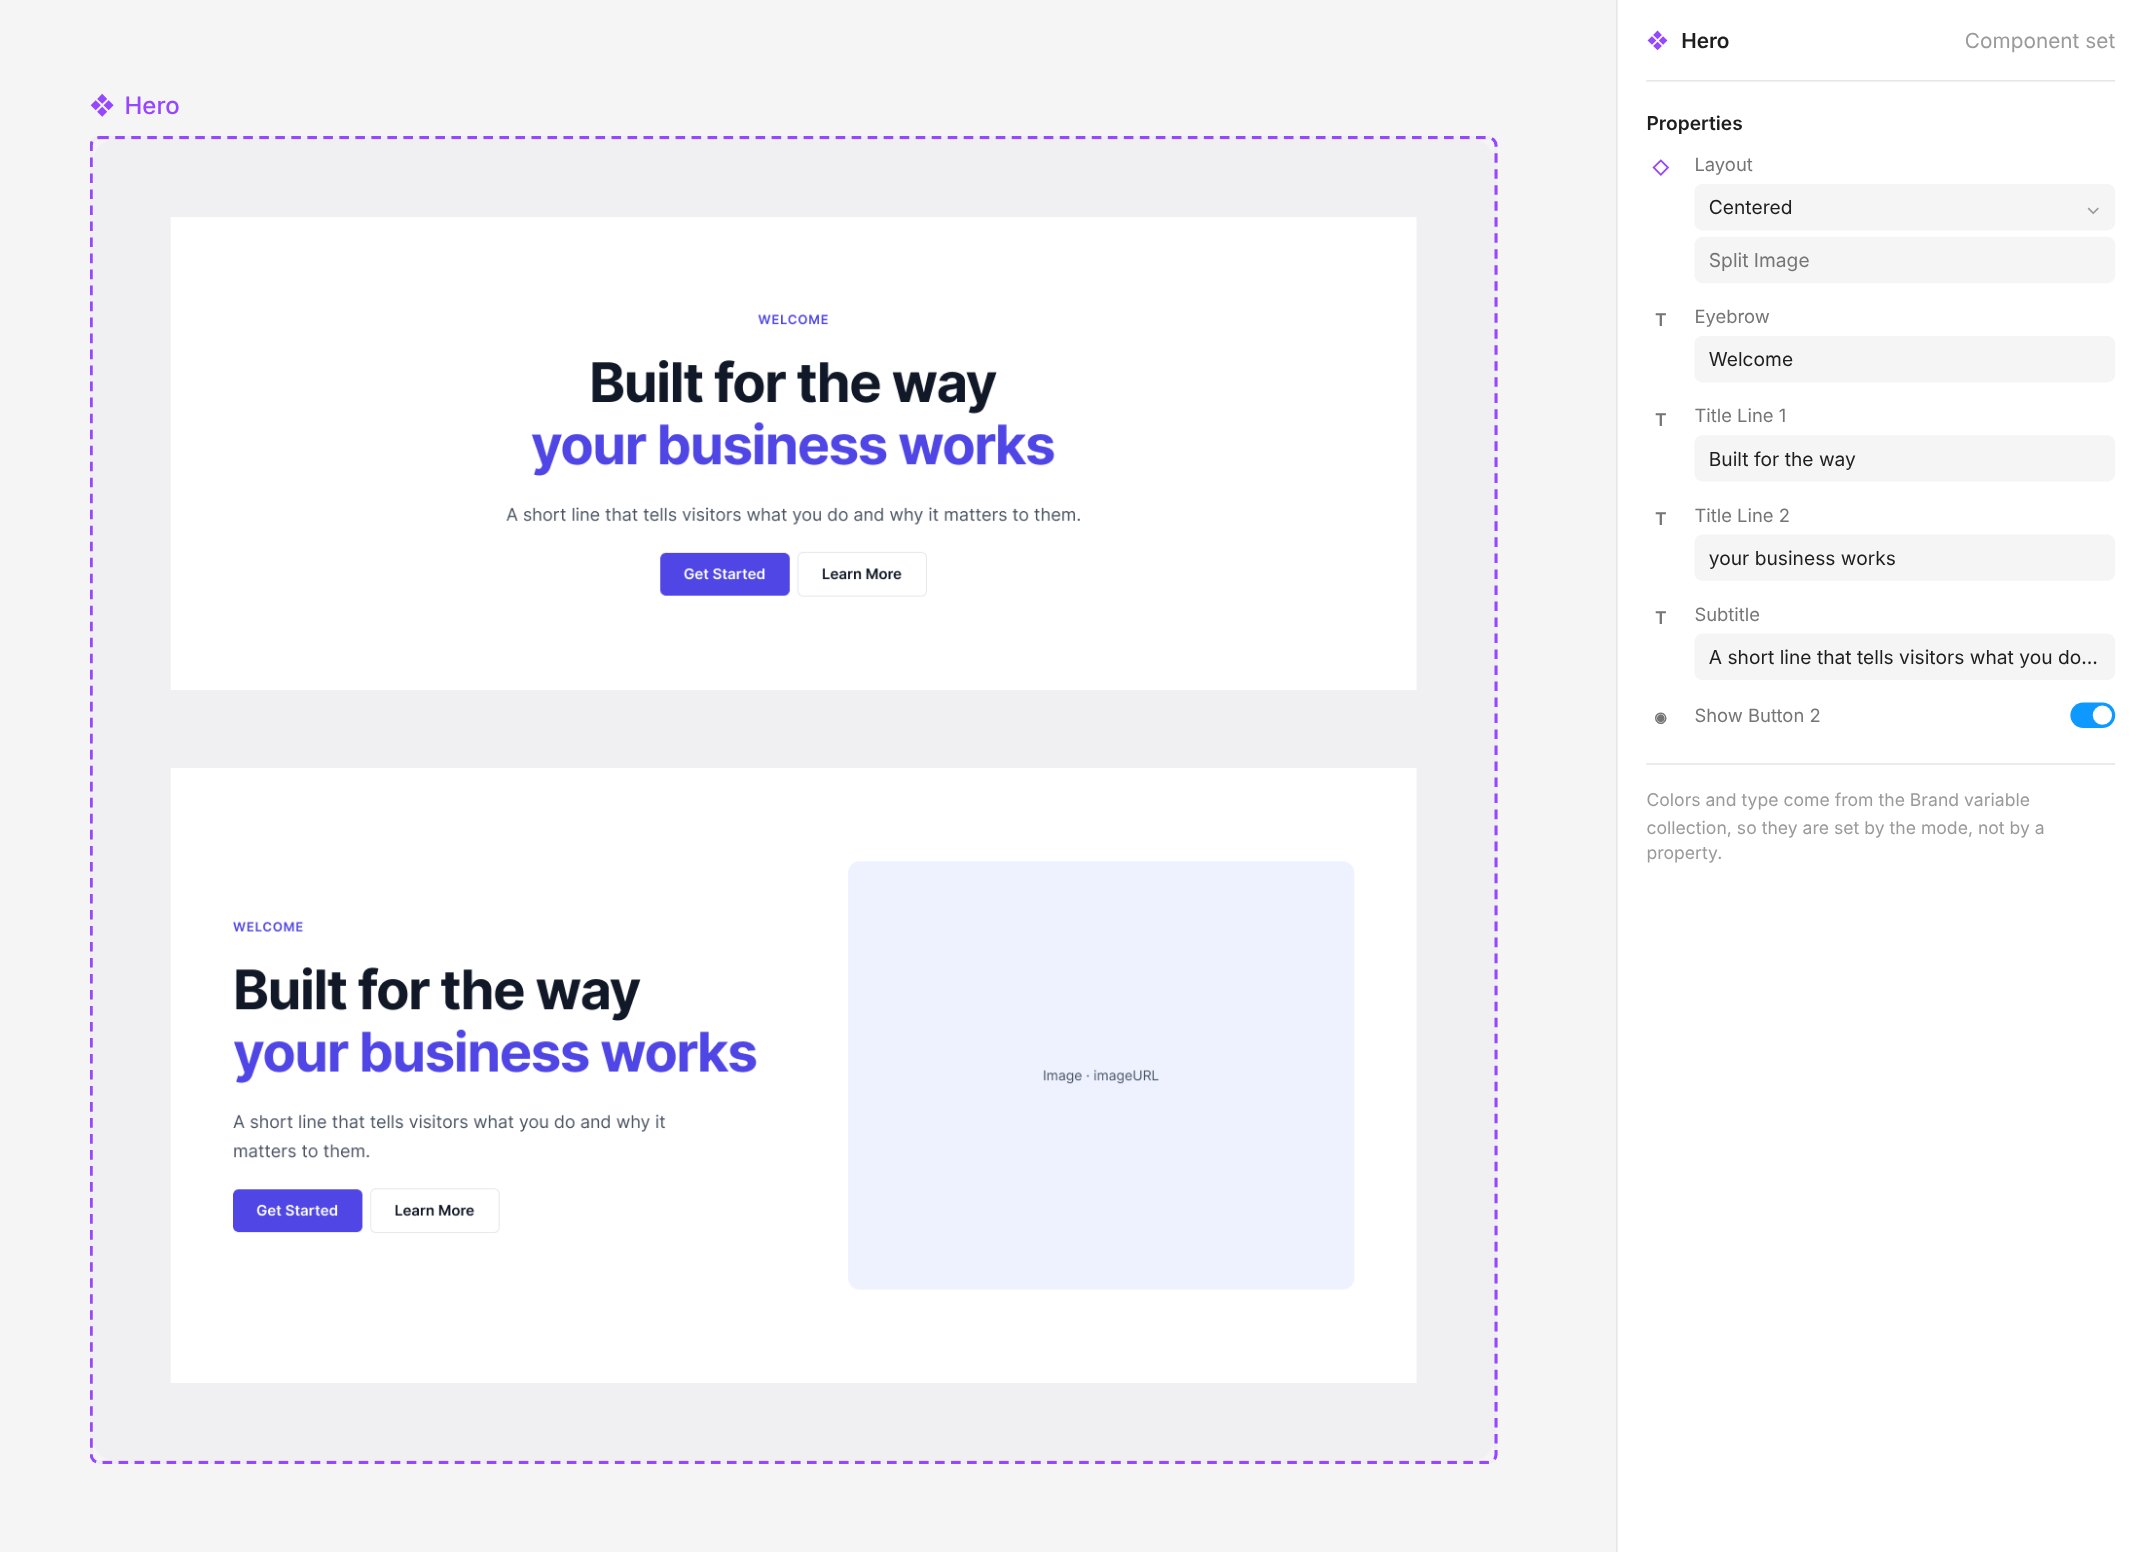
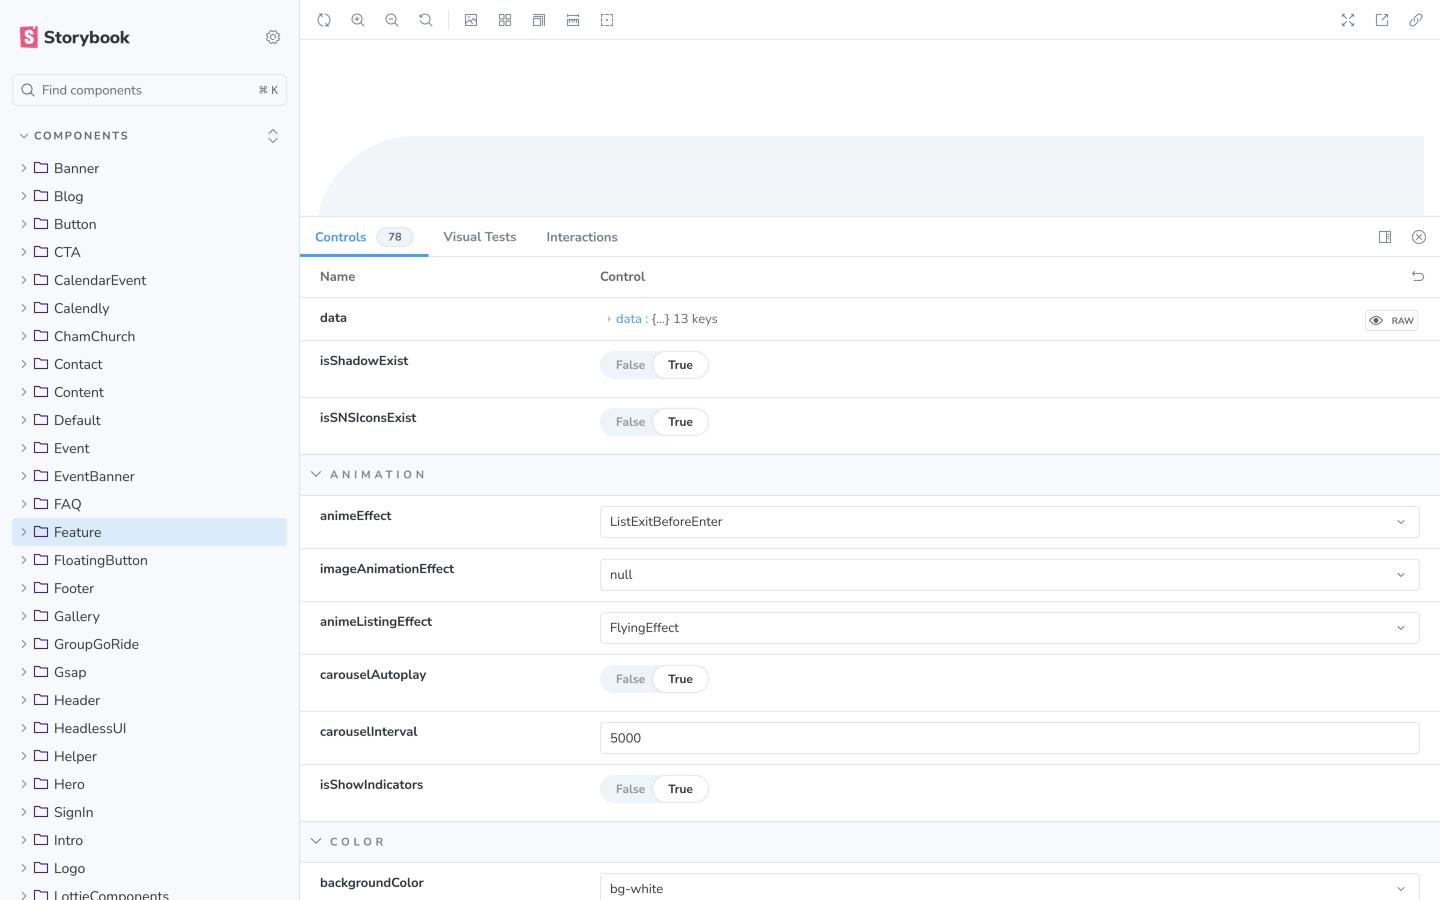
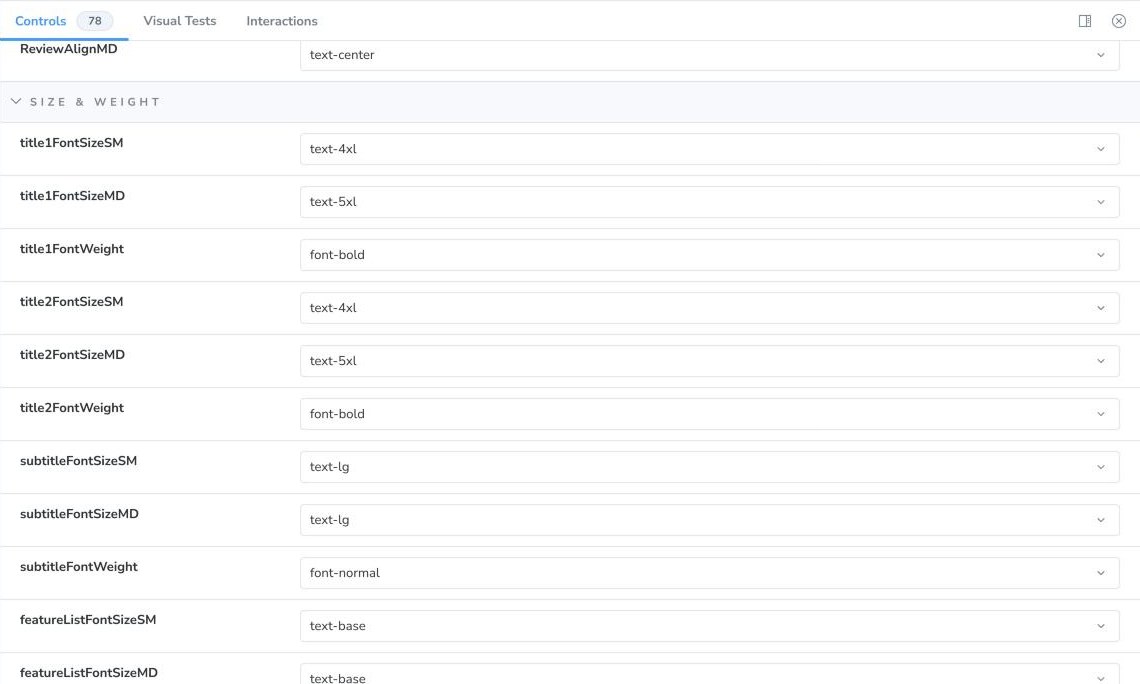
Properties let one component fit any brand. The most configurable hero has 83.
Components by section type
Handoff & QA
A consistent design-to-code handoff and QA process.
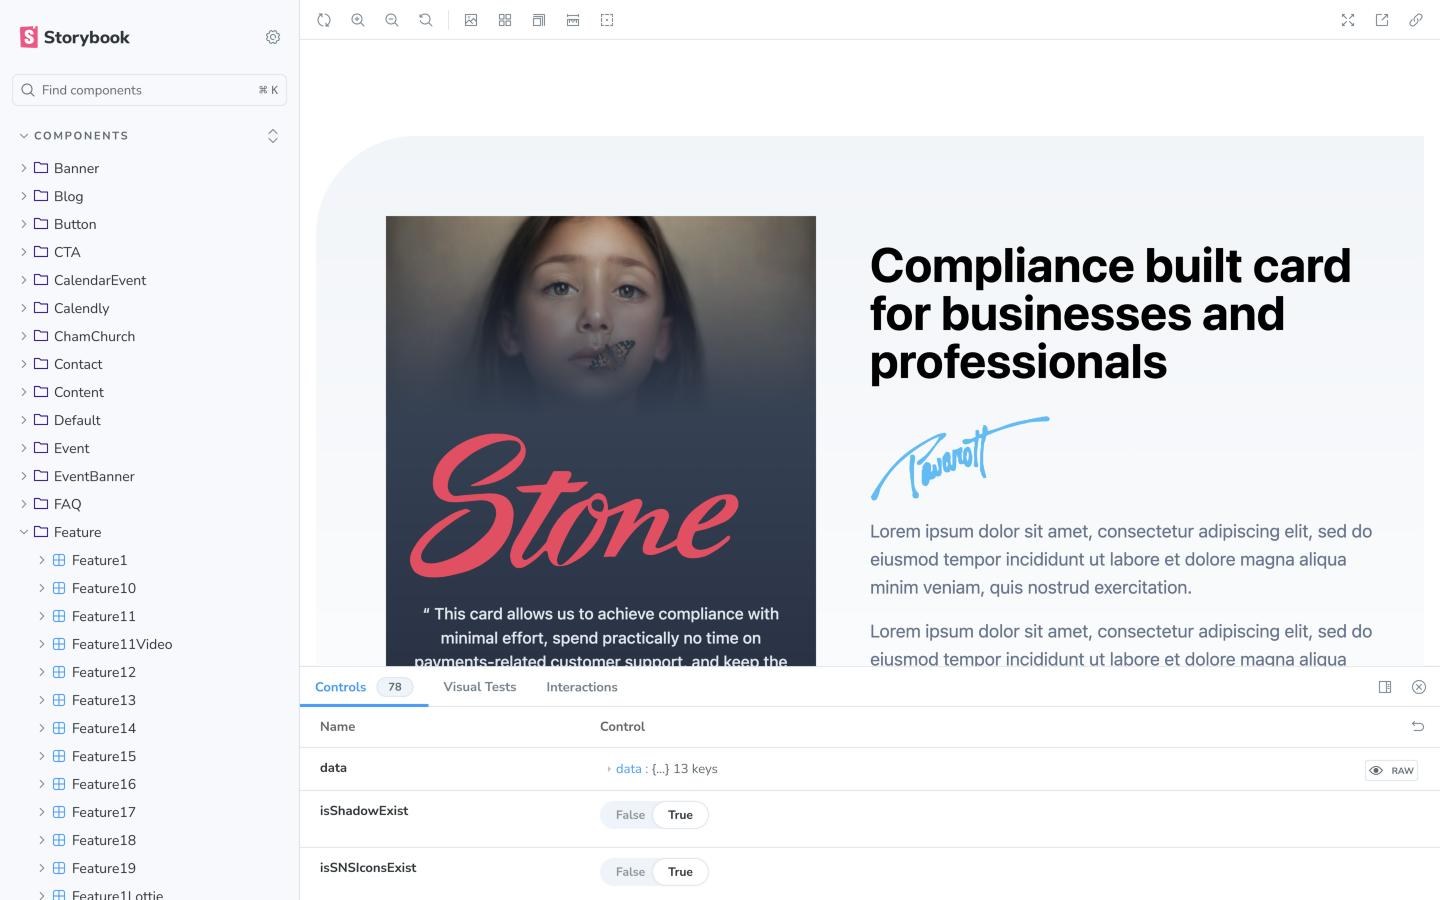
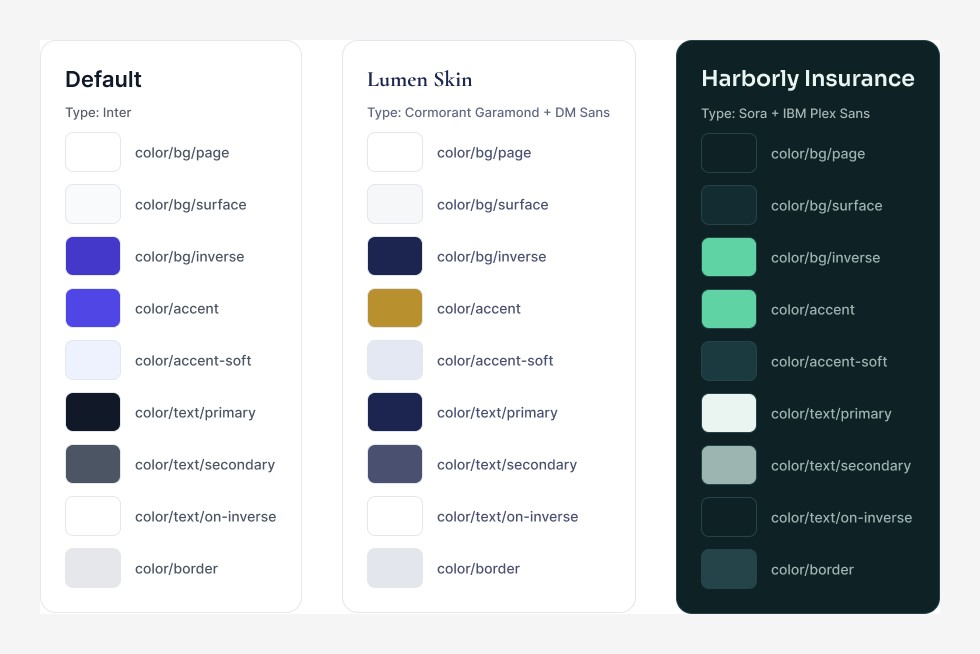
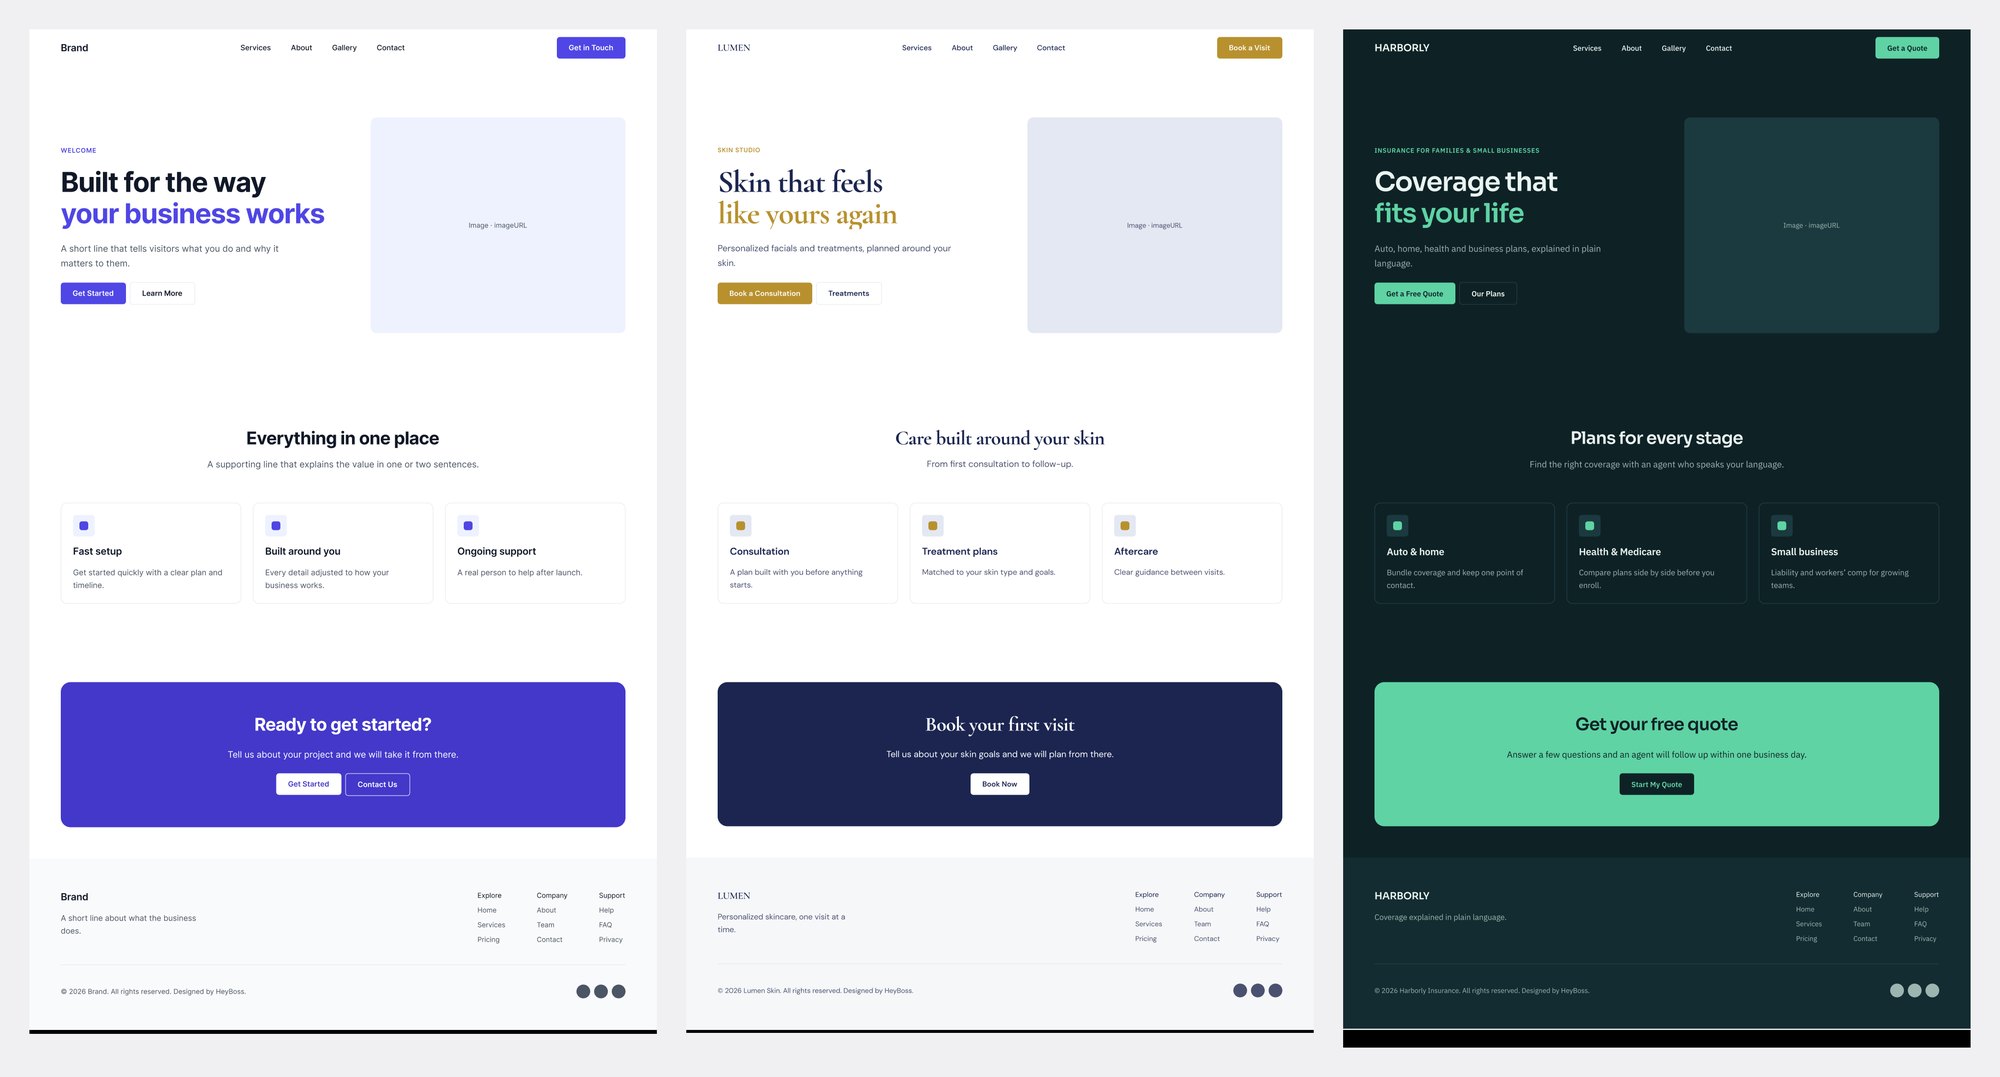
Components use semantic tokens, with one theme per client. Switching the theme restyles every section.
Workflow Change
Shifting site assembly from engineers to designers.
Once the library was large enough, page assembly became the bottleneck. So designers took it over: set properties in Storybook, assemble the page in code and open a pull request. Engineers only review.
Anything new a client needs gets designed in Figma first, then added, so the library grows with every client.
Impact
Twice the client capacity with the same team.
Build time roughly halved, and almost all of that came out of development.
Times are typical for a one-page site and vary with the project.
What came next
In 2026, site builds moved from this library to the AI design workflow, which keeps the same principle: each client's design system is set first, and every page is built from it. A one-page site went from 3–4 days to 1–2.
Reflection
What I'd do differently
Realigning e-commerce UX around real US customers
Overview
A Black Friday sale fell way short. The content was talking to the wrong people.
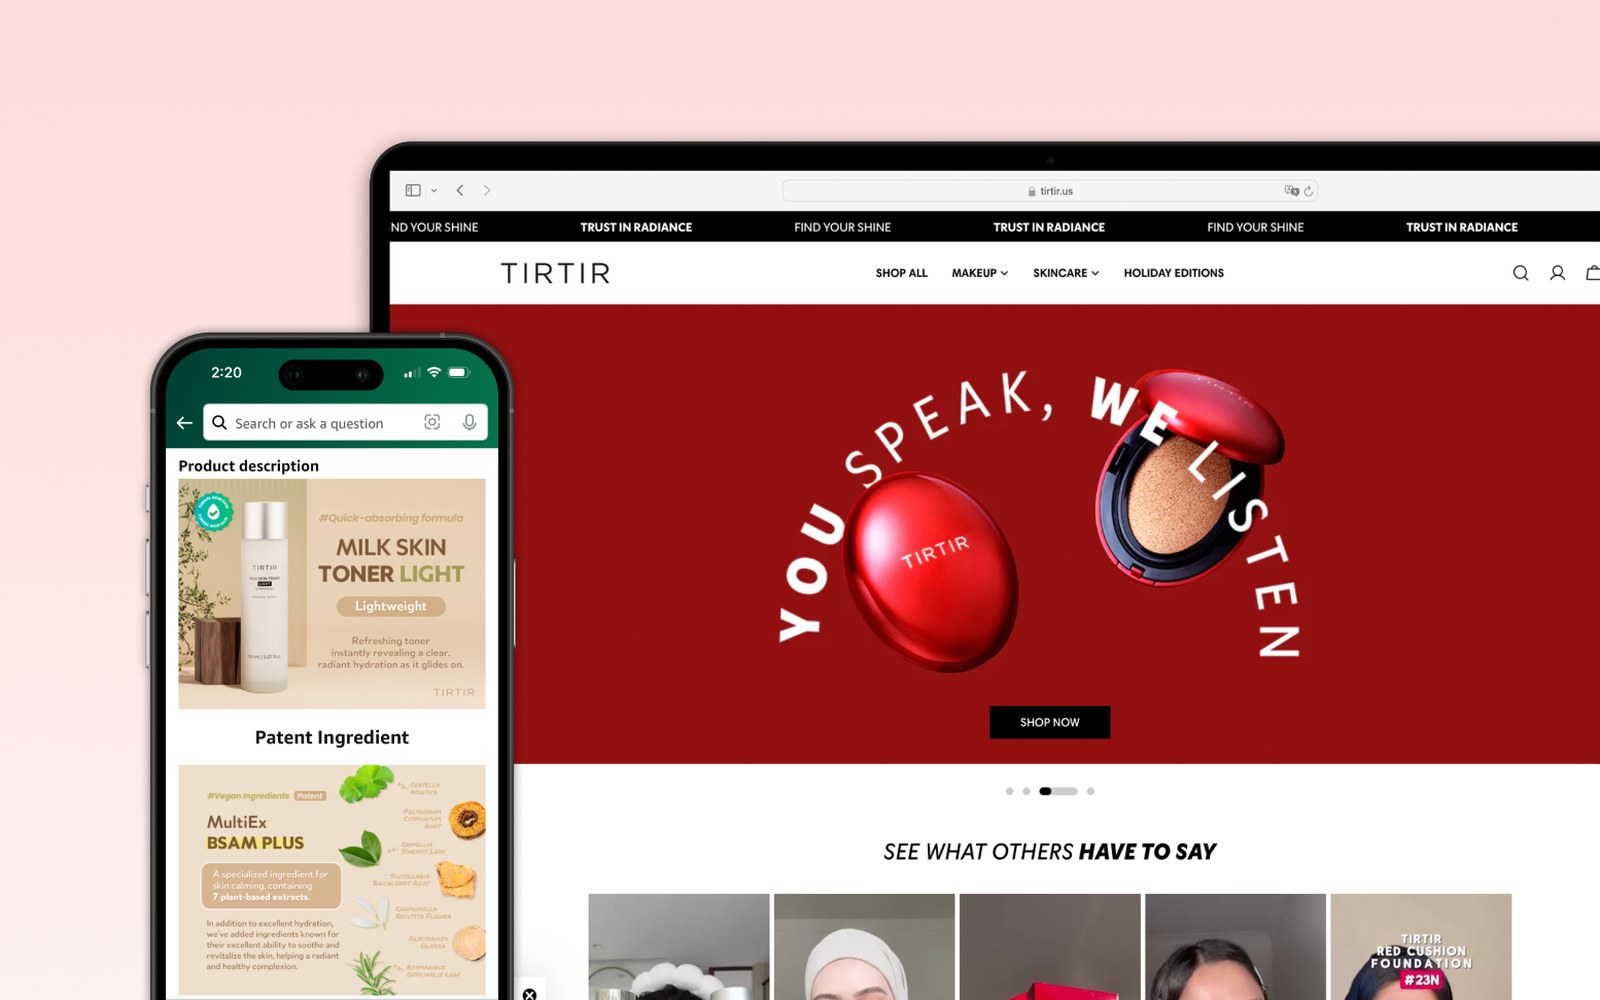
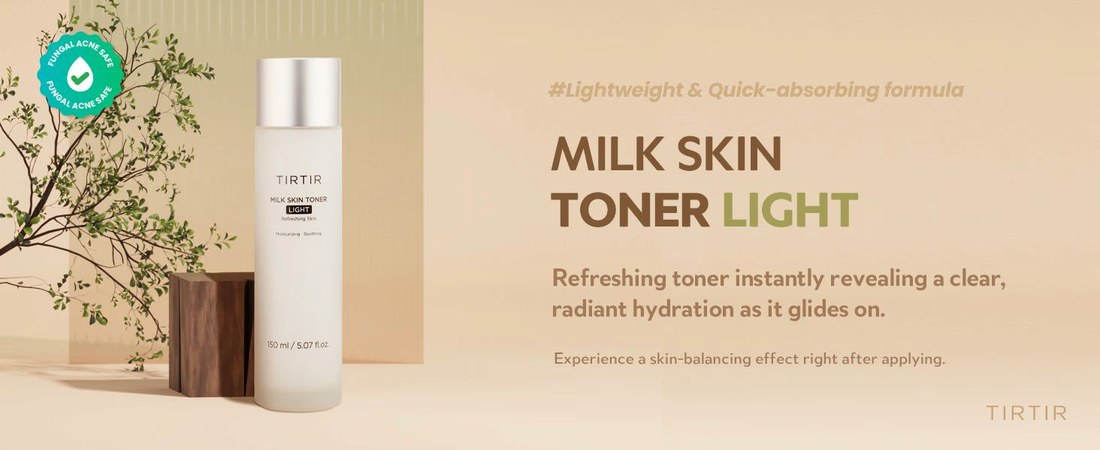
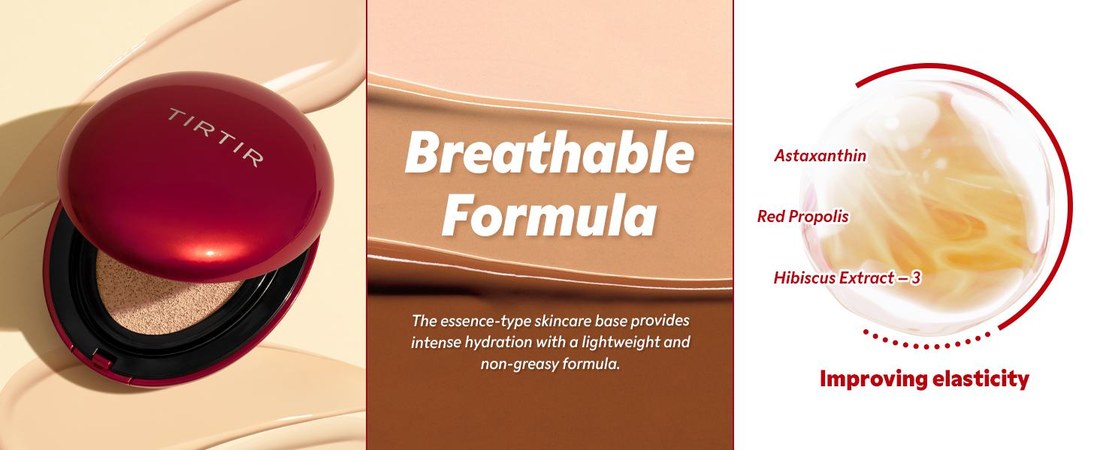
TIRTIR is a K-beauty brand expanding in the US. A Black Friday promotion forecast at 20–30% purchase conversion closed at 10%.
The problem
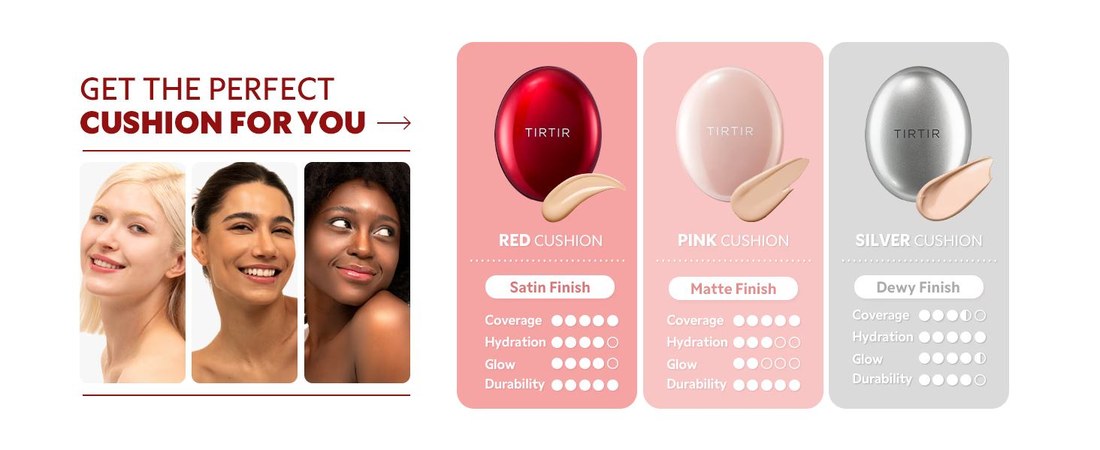
The ads reached 18–34 year olds, but every banner, product page and post was made for buyers aged 30–40. Visitors found nothing made for them.
The goal
Win the audience the ads were already bringing in, and turn their visits into purchases.
What I did
- Funnel analysis by age
- Content audit: what worked, and for whom
- Competitive research on the brands this audience follows
- A new content direction built around one audience persona
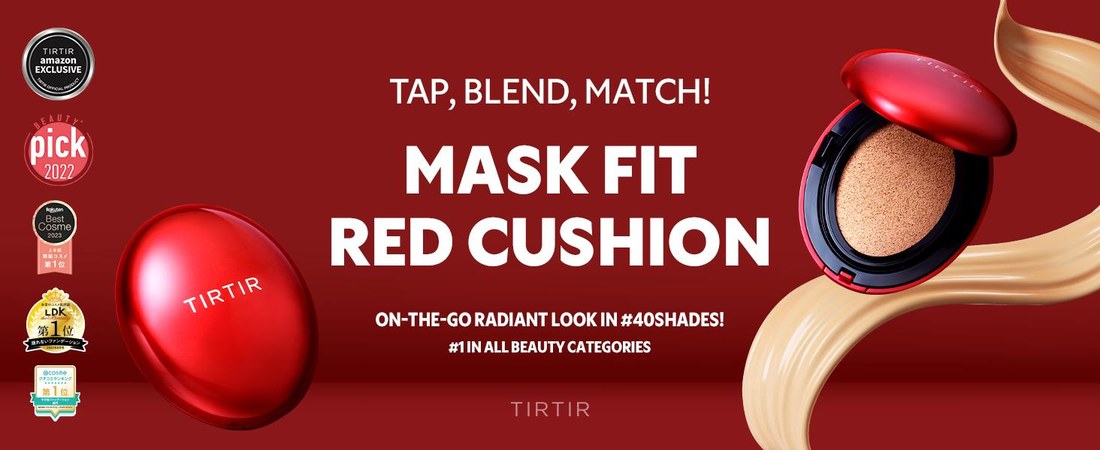
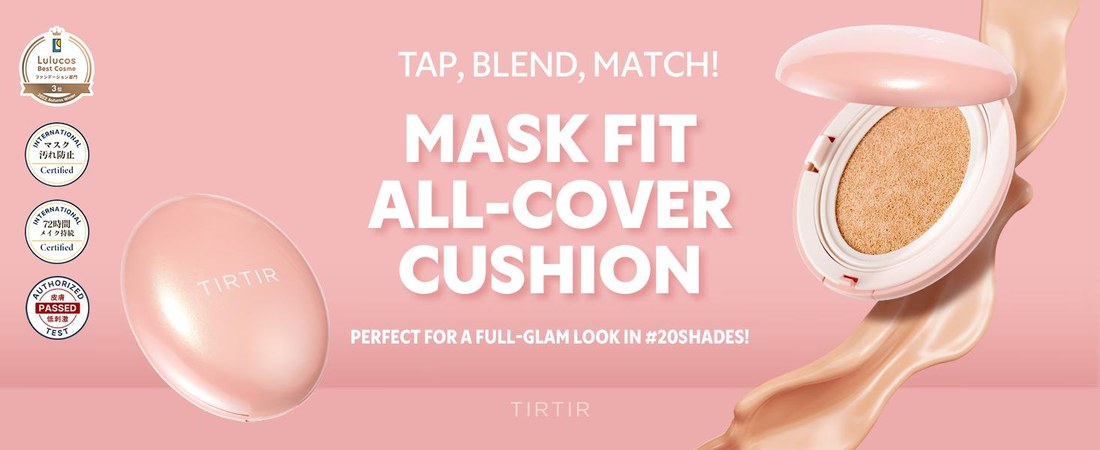
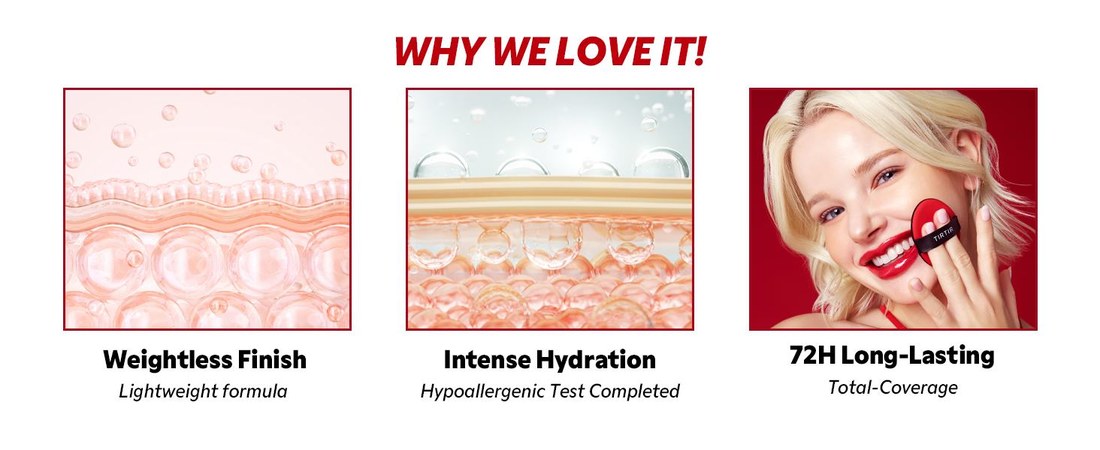
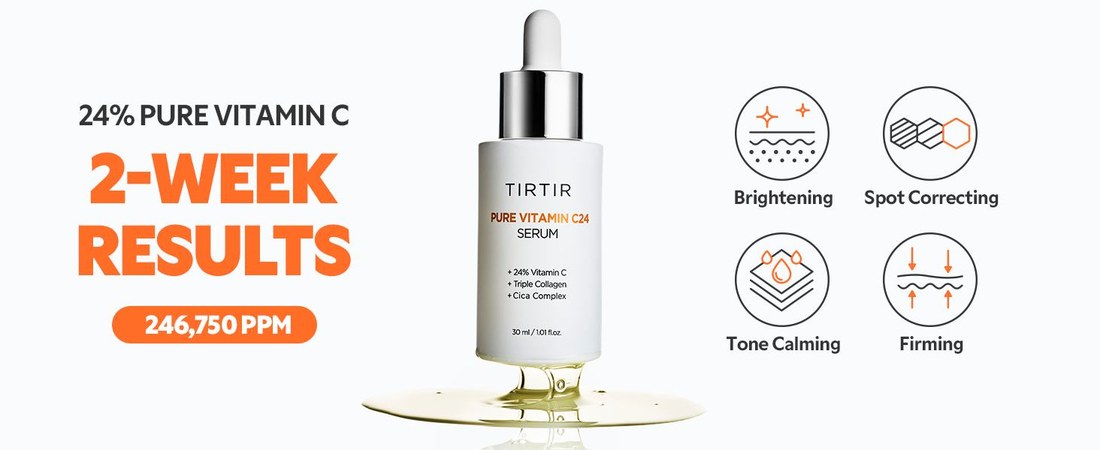
- Product banners, Amazon product pages and campaign assets, A/B tested, then rolled out
Design principles
- 01Audience-first content
- 02Conversational brand voice
- 03Cohesive visual system
Final Design
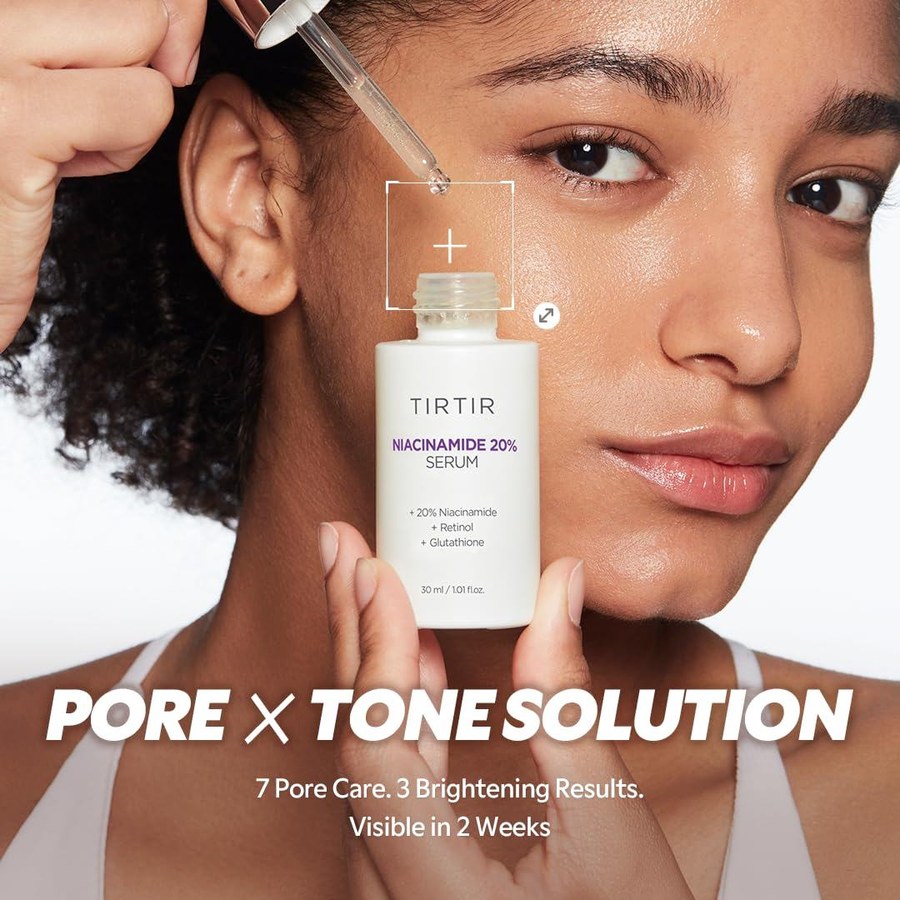

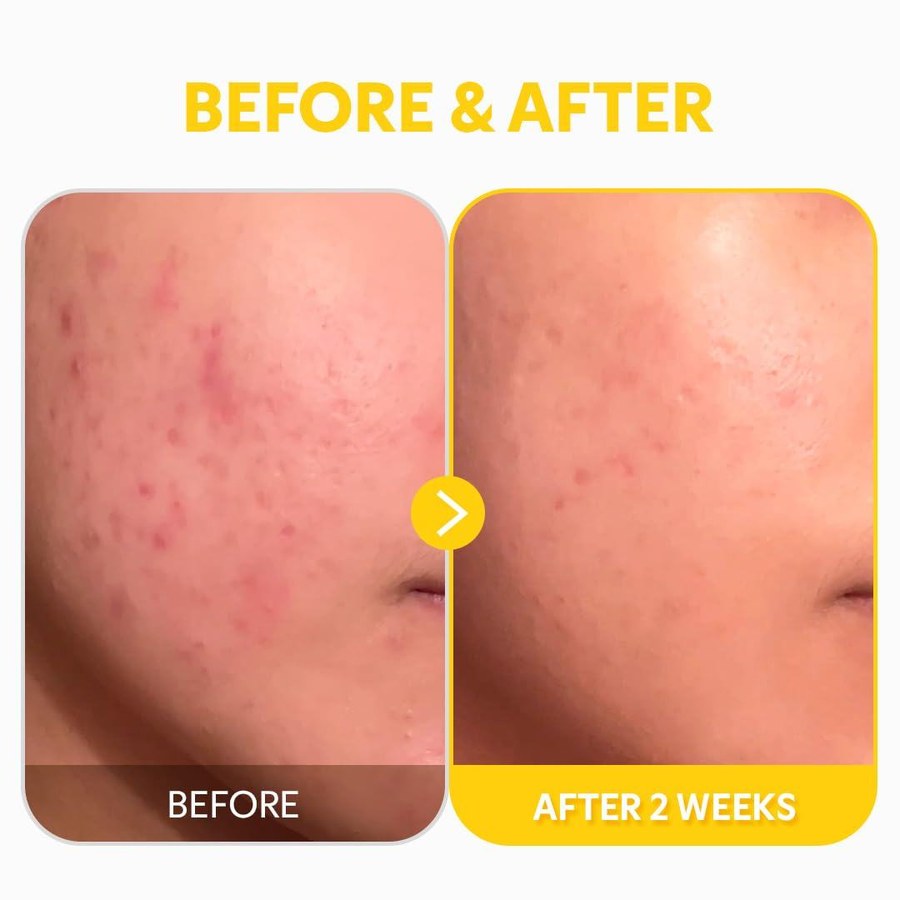
Context & Problem
Traffic was high, but purchase conversion stalled at 10%.
Visitors reached the product pages, but didn't buy.
Data Analysis
Funnel analysis revealed an audience mismatch.
I split the funnel by age. The ads reached 13–34. The people clicking were 18–34. The people buying were 30–40, and every piece of content was built for them.
Age band by funnel stage
The people the ads were working on found nothing made for them.
So I proposed moving the content's target to 18–34, the group most interested in the product.
The argument I made internally
Don't design for the buyer you already have when your growth is coming from somewhere else.
Content Audit
A content audit: built for credibility, not desire.
- Working
- Each product's color led the layout, the selling points were easy to read, and the numbers backed up the claims. For a 30–40 buyer: clean and direct.
- Not working
- For the 18–34 crowd actually showing up, it felt stiff. Polished, but like something to handle carefully, not pick up.
The existing content
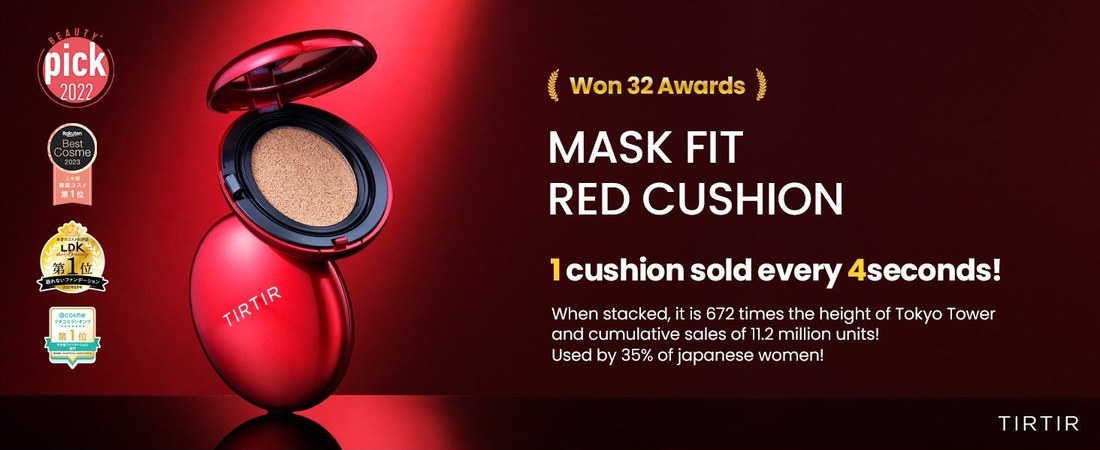
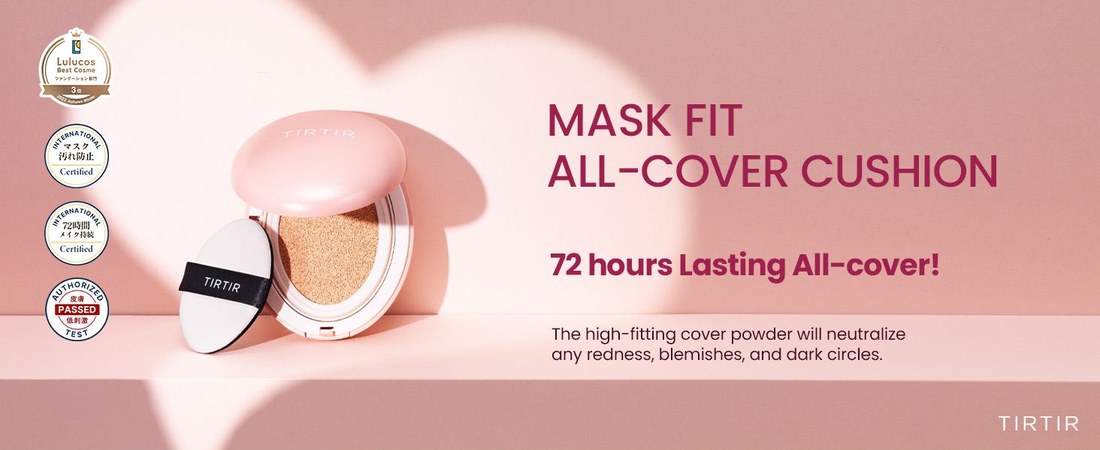
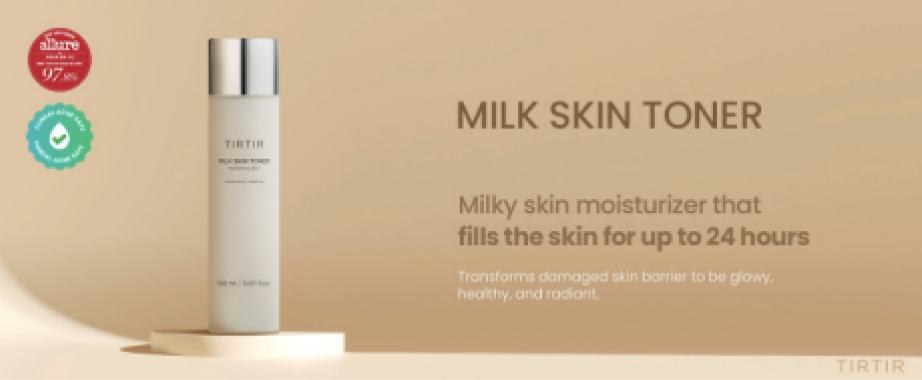
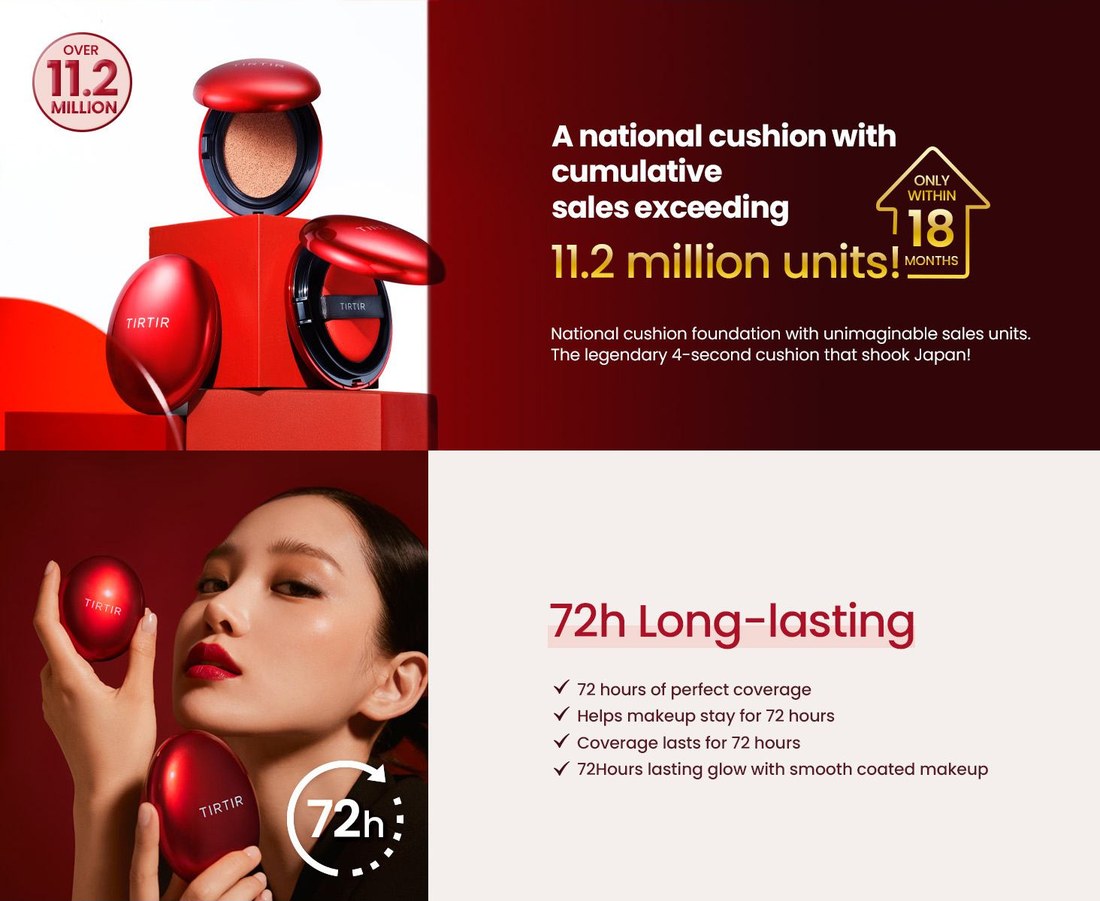
One detail stuck with me: the smaller products that converted well were all built around one color from their own packaging.
Competitive Research
Competitive research on what this audience responds to.
I looked at the casting, palette and tone of the brands 18–34 shoppers follow.
Competitor A · Laneige
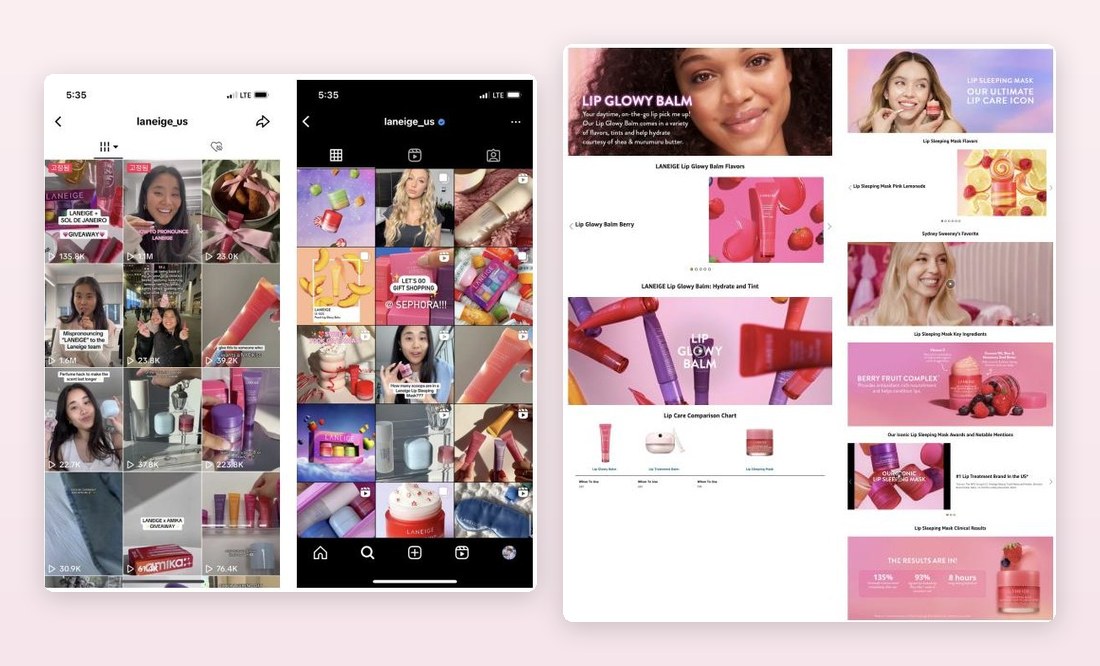
Competitor B · Anua
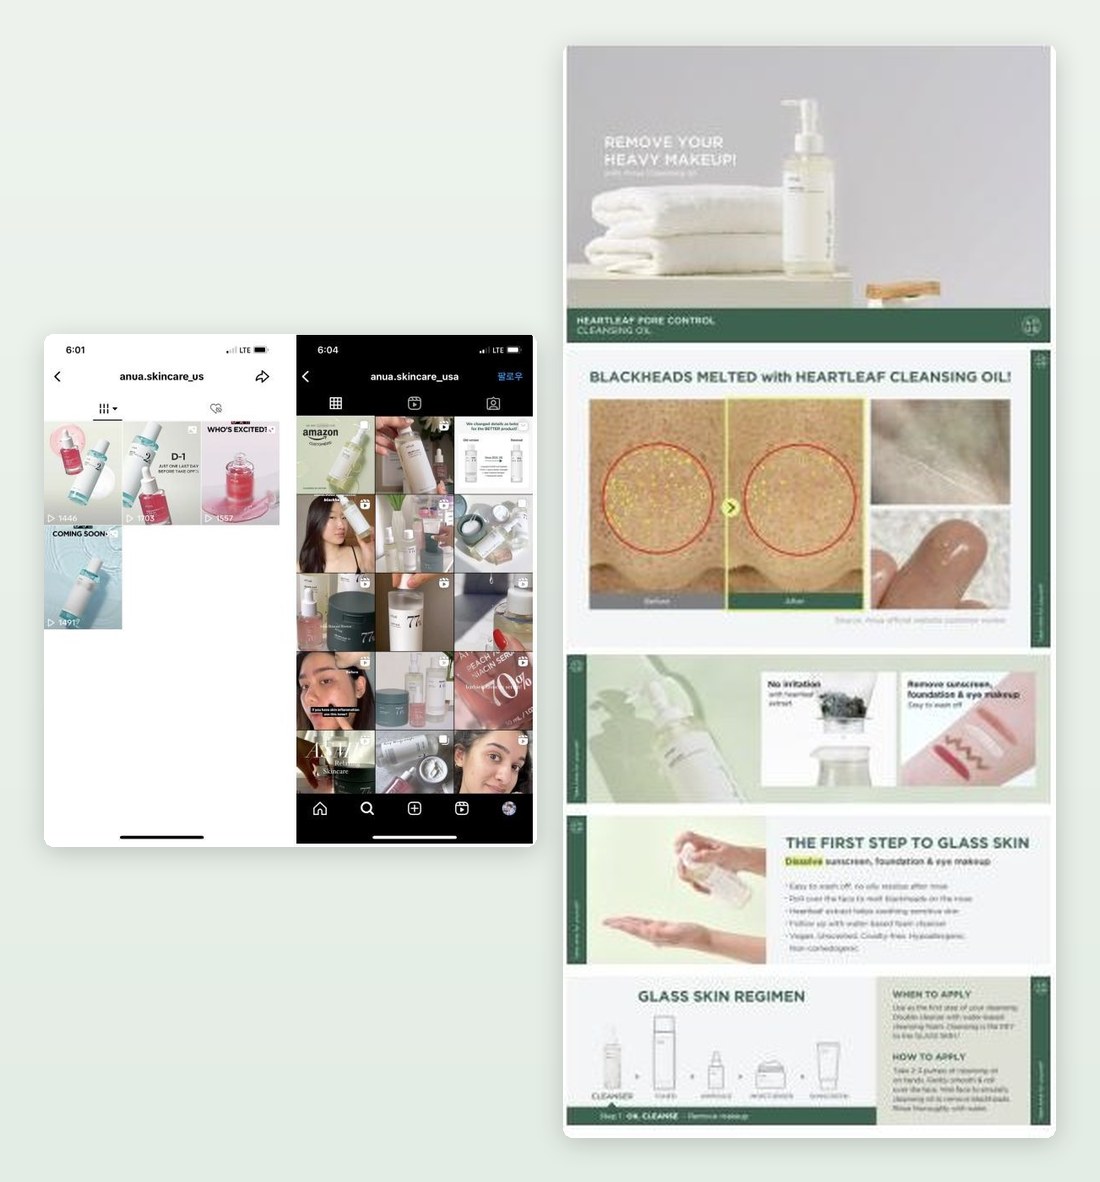
Both lead with people and texture, not awards. These keywords kept showing up:
Instead of a mood board, I defined a persona for the brand voice:
A recommendation blog from a woman in her twenties with good skin who takes care of how she looks. Fun, warm, and speaking to you.
With that voice set, type, color and copy mostly followed.
Design Direction
Three design decisions defined the new direction.
Before & After
Validated with A/B tests, product by product.
I A/B tested a set of products first, then rolled it out across the range.
Before
After
Before
After
Before
After
Rollout
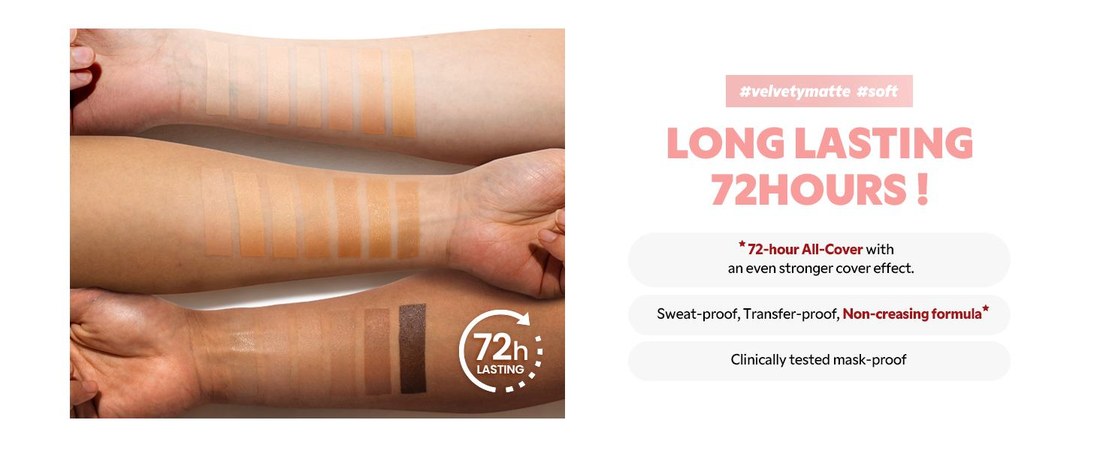
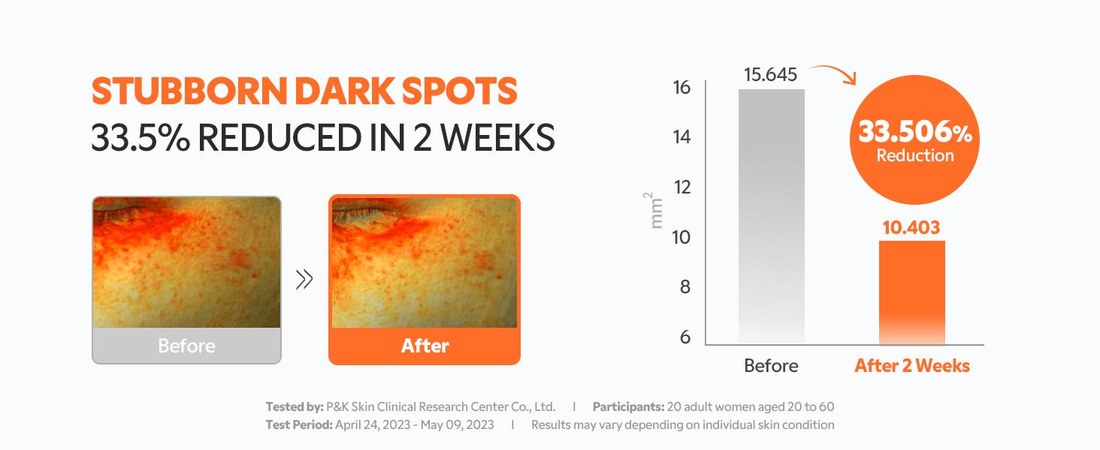
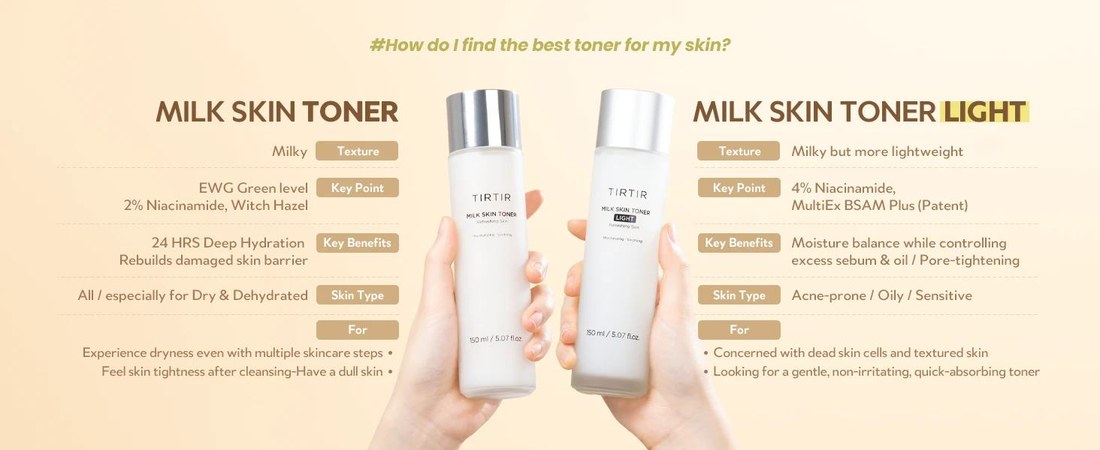
Rolling the system out across the product range.
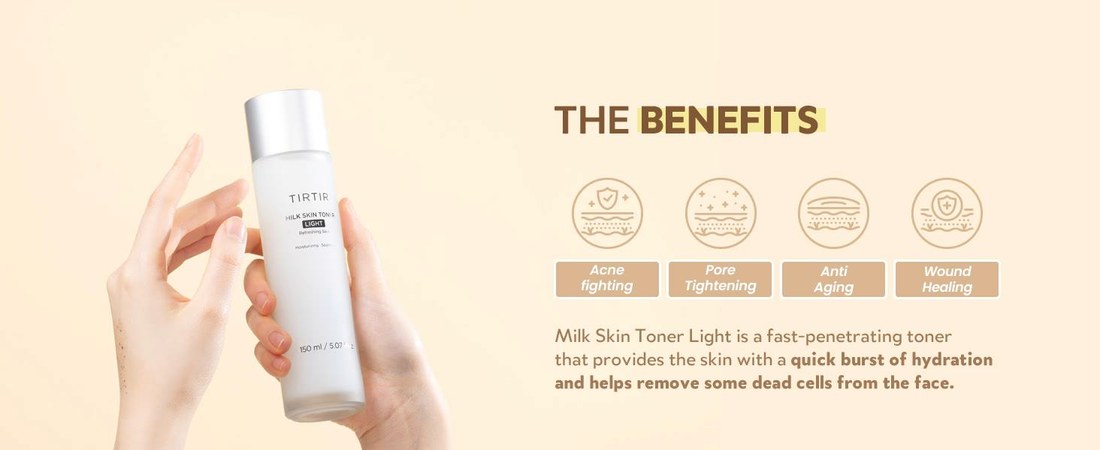
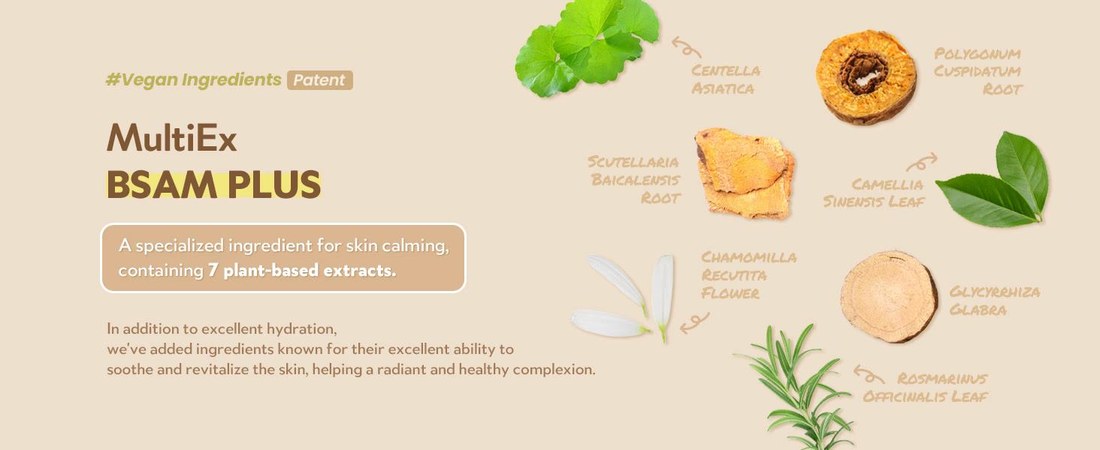
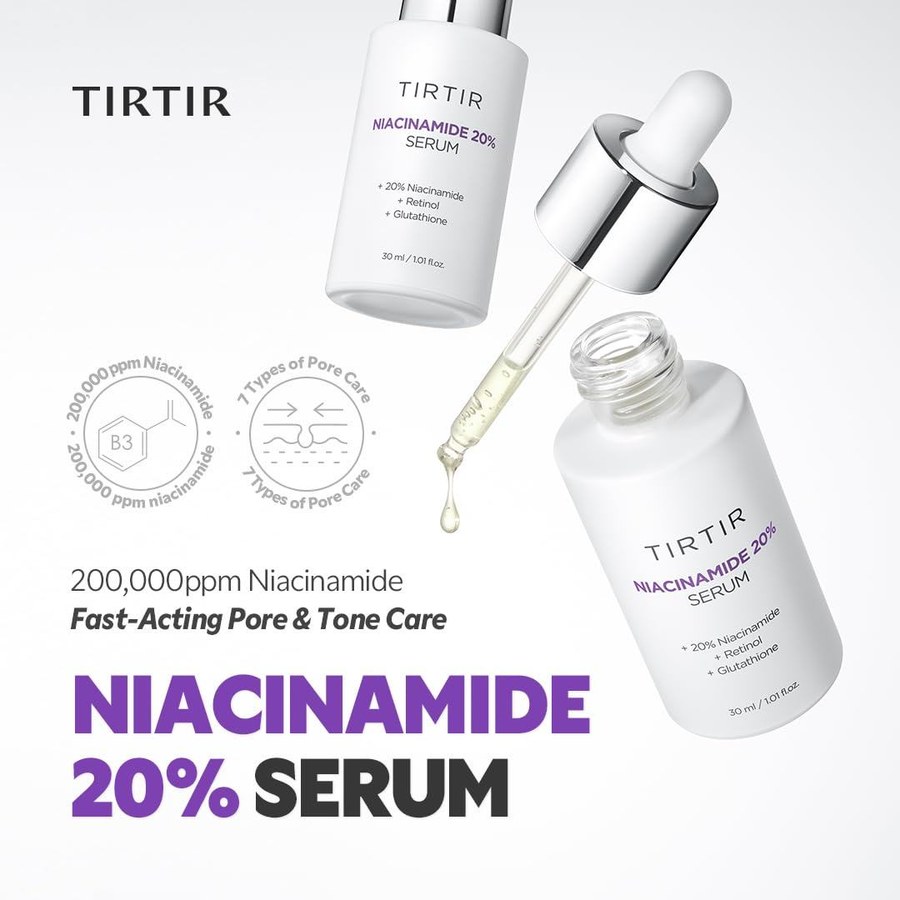
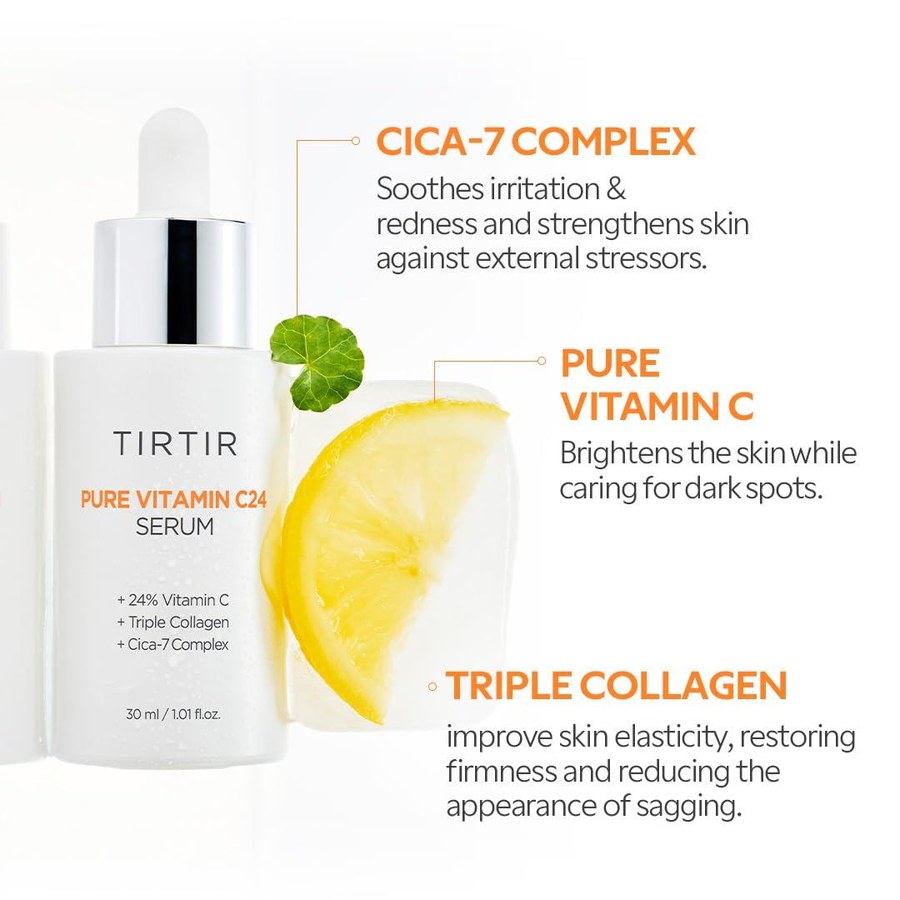
Impact
Purchase conversion nearly tripled on Amazon.
Purchase conversion, the quarter before vs. the quarter after the rollout.
Shopify moved the most in relative terms, which is where the new voice and warm palette show up most.
Driving re-engagement with goal-oriented mobile UX
Overview
Users stopped opening the platform they run their business on.
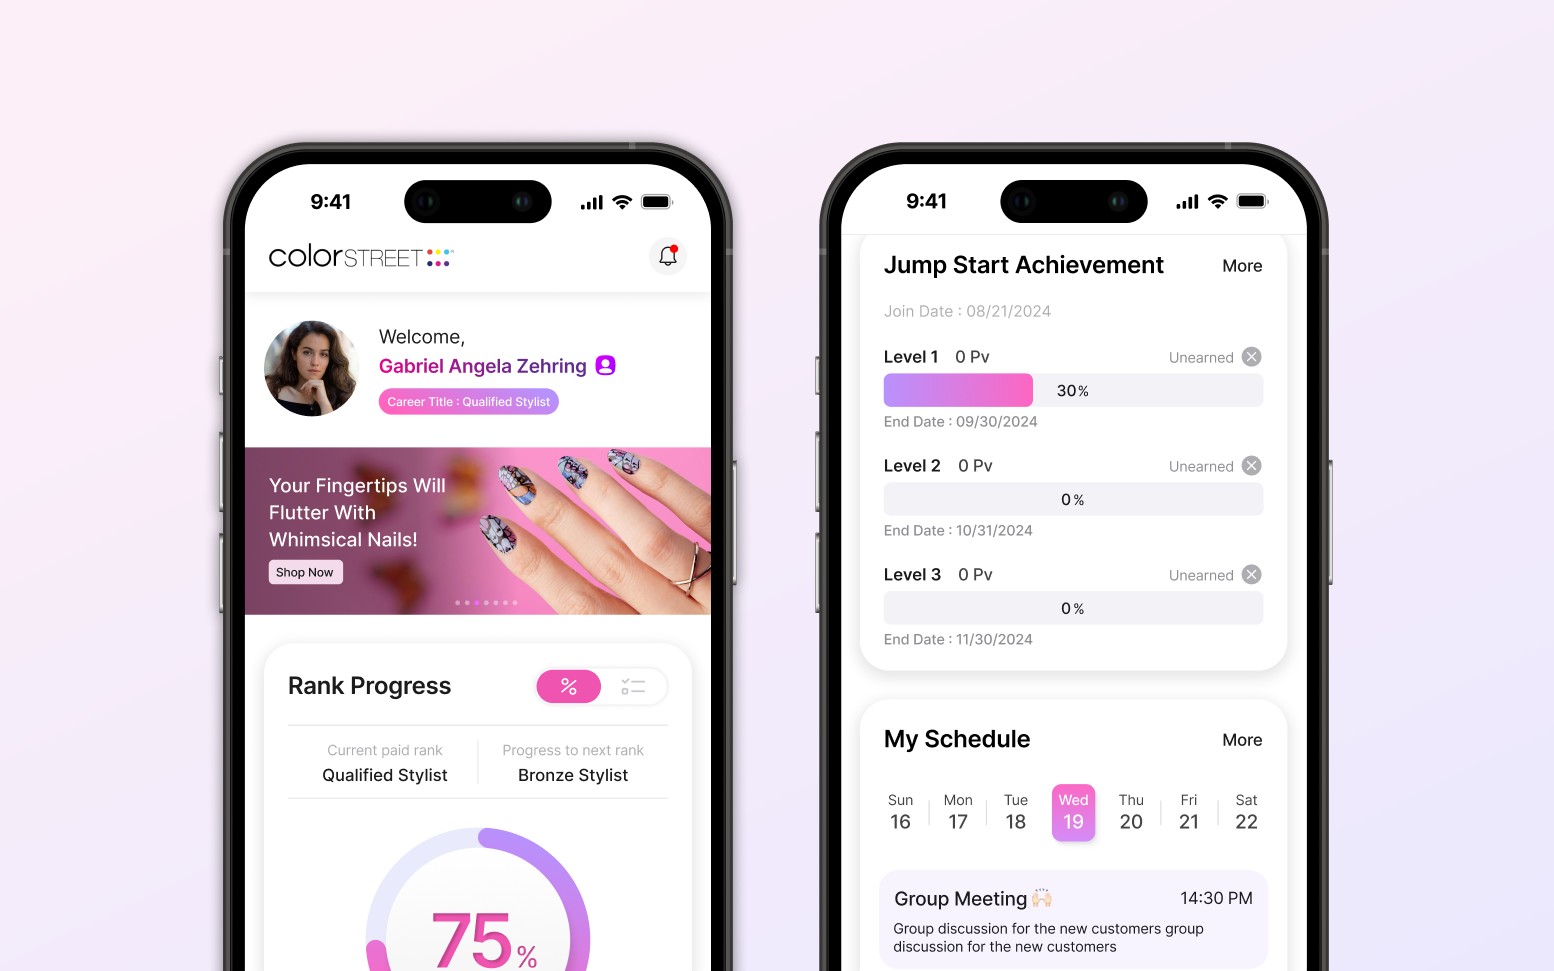
Color Street sells nail products through a network of independent sales reps who build teams and climb sales ranks. Its web platform was the company's main way to reach them, and logins were falling along with sales.
The problem
Opening the platform felt like work: a manual login, desktop only, and dense charts with no clear priority. Nothing gave users a reason to come back.
The goal
Give users a reason to open the app by putting their progress first and letting the app reach out.
What I did
- Mobile design system shared by all four app sections
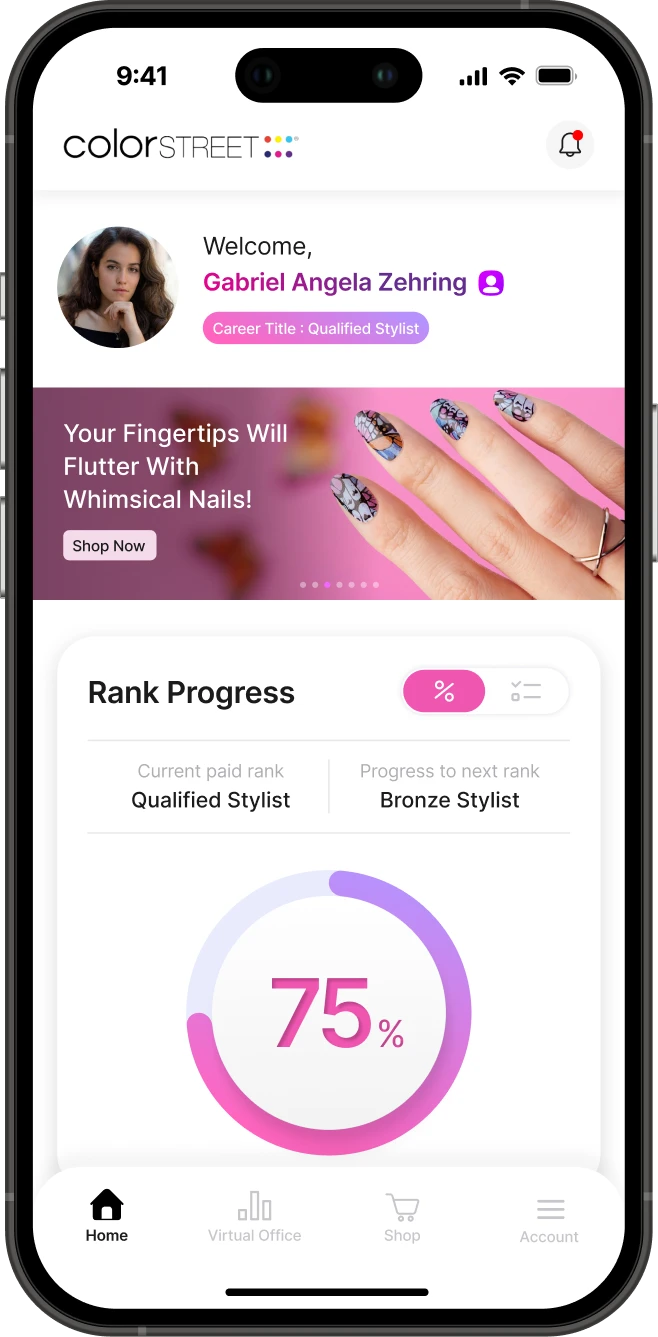
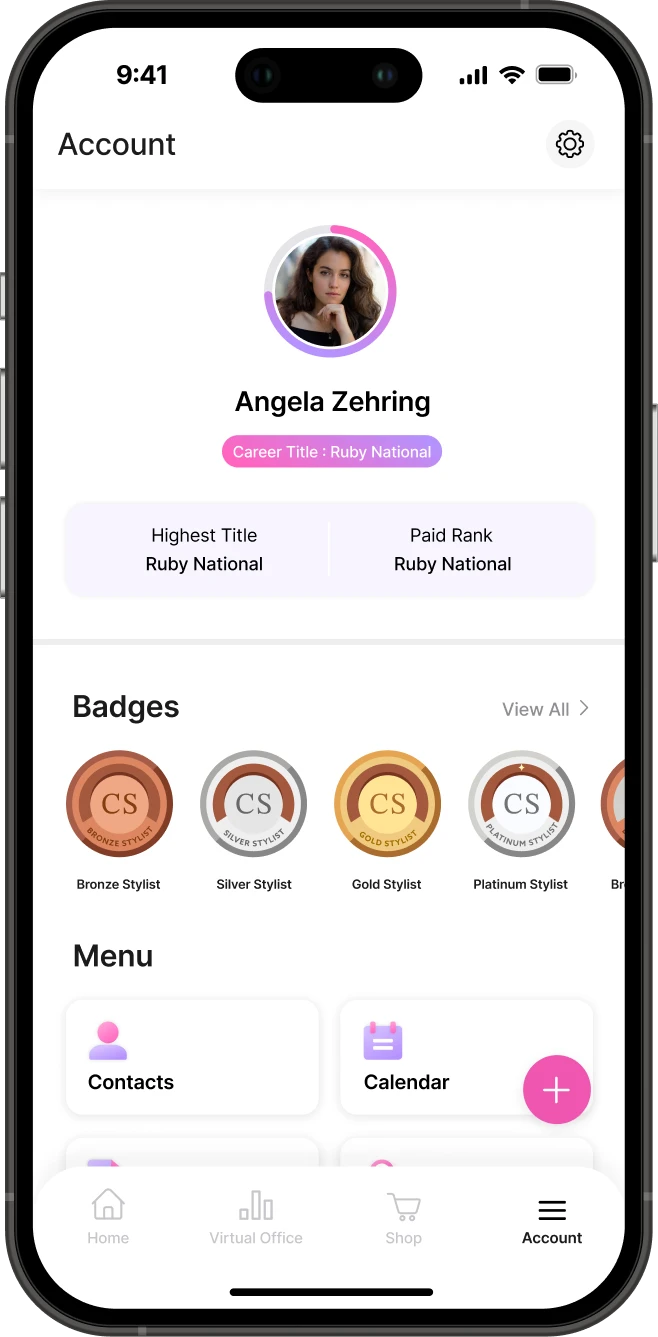
- Home and Account, rebuilt around rank progress
- Information hierarchy: progress first, next steps one tap away
- Field research at the national conference, turned into a rewards feature
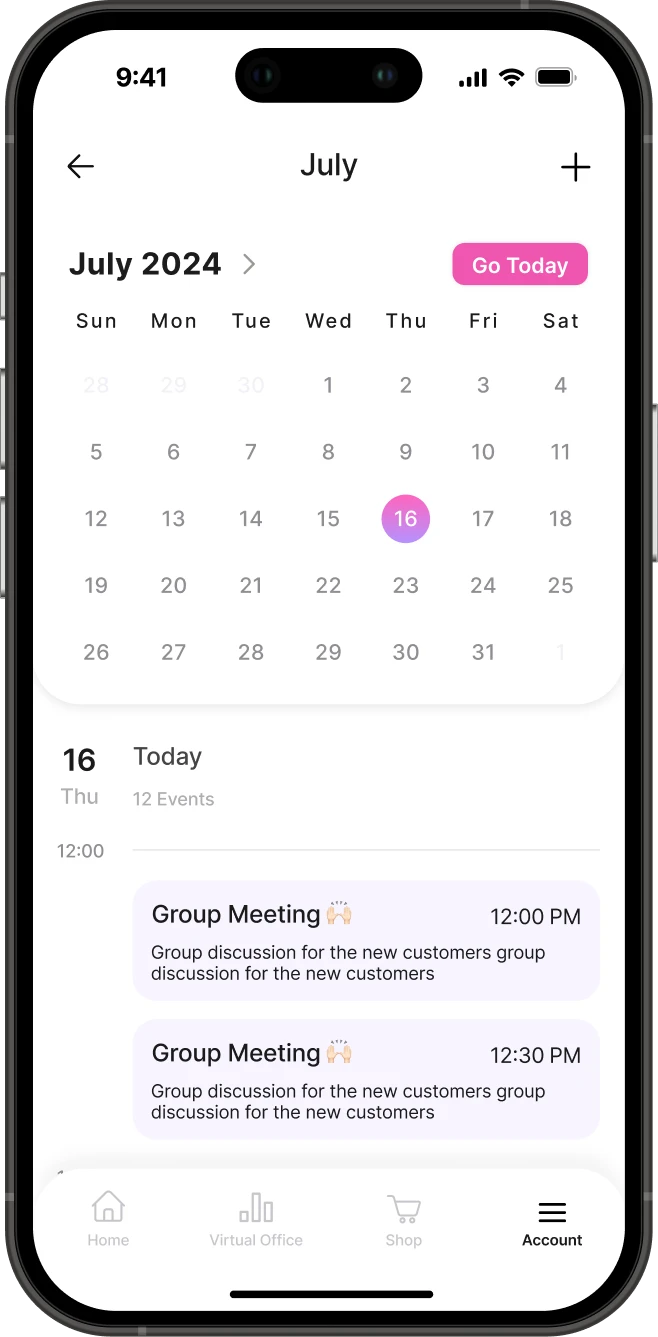
- Calendar and notifications that bring users back
Design principles
- 01Motivation-first hierarchy
- 02Progress made actionable
- 03Proactive re-engagement
Final Design
Context & Problem
High friction and no motivation drove users away.
Fewer logins meant fewer reminders of their goals, and sales followed.
The loop the platform was stuck in
From pain points to requirements
Each pain point became a product requirement.
Before · Why users stayed away
- A manual login every session
- Desktop only
- Too many data graphs with no clear hierarchy
- Key metrics hard to read at a glance
- Cluttered menus full of low-value pages
- An outdated UI that felt dated and heavy
- No motivational features to drive engagement
After · What the app had to do
- Face ID, so opening the app takes seconds
- Mobile first, in their pocket between sales
- Prioritized data that shows what matters most first
- Clear, readable data visualization
- Streamlined navigation with only what's needed
- A modern, trend-forward visual system
- Badges, notifications and a calendar that build a habit
The reframe
Most of that list is friction. Only the last row gives users a reason to want to open the app, and that shaped the new features.
Design System
A shared design system for one consistent experience.
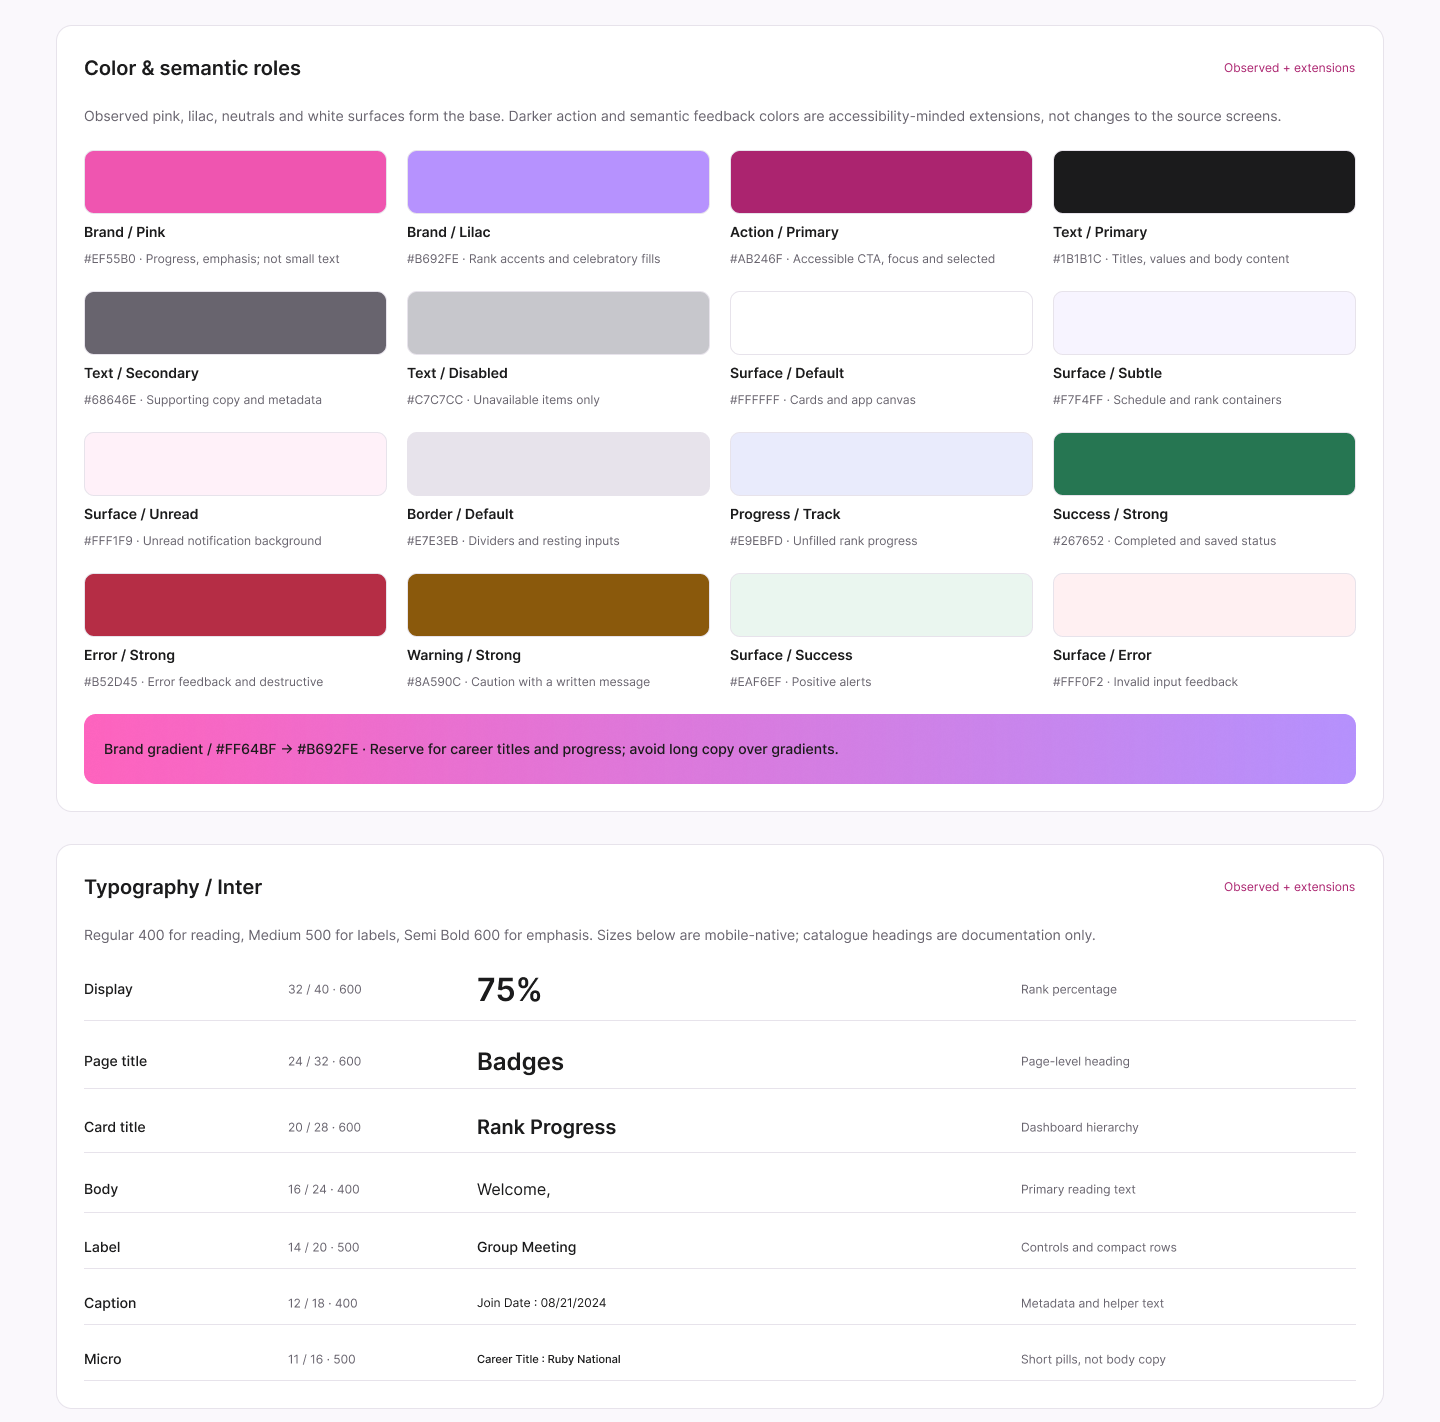
Foundations · color roles and type scale
Component library · a selection
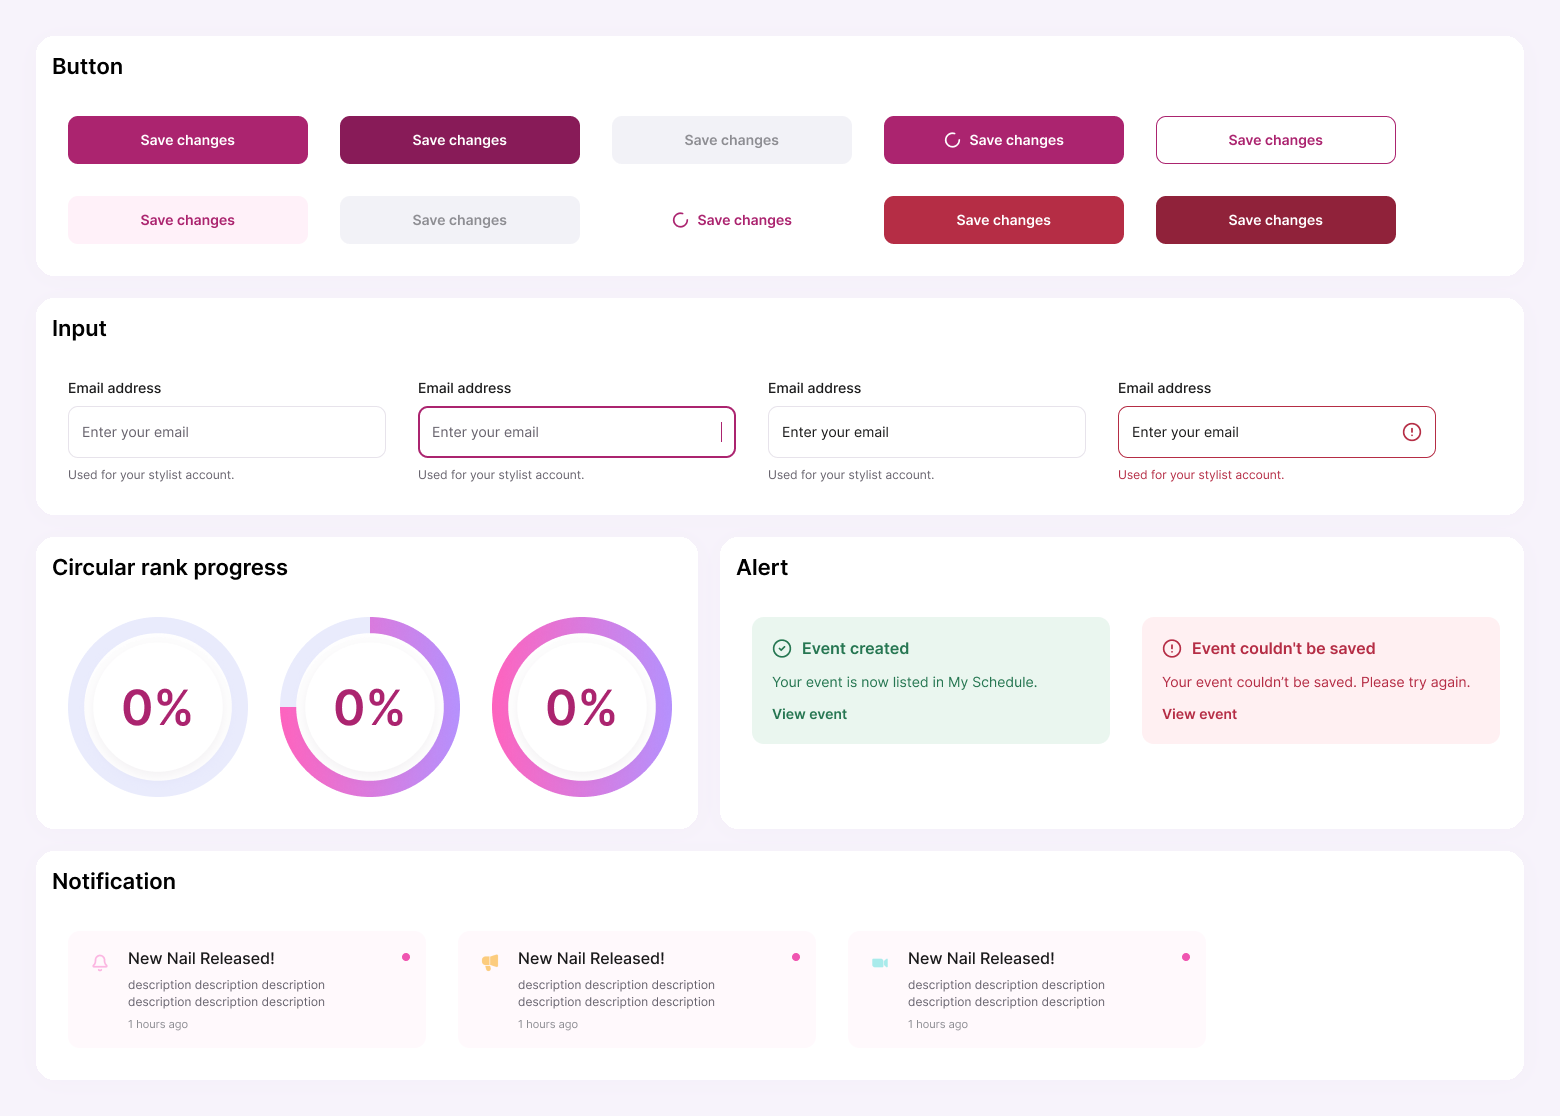
One rule carried the product strategy into the visuals: the brand gradient is reserved for rank. The thing users care about most is always the most prominent element on screen.
Information Hierarchy
Restructuring Home's information hierarchy around user goals.
The old dashboard gave every chart equal weight, so users had to work out what mattered. I ordered Home by the questions users ask when they open the app, so the most motivating information comes first.
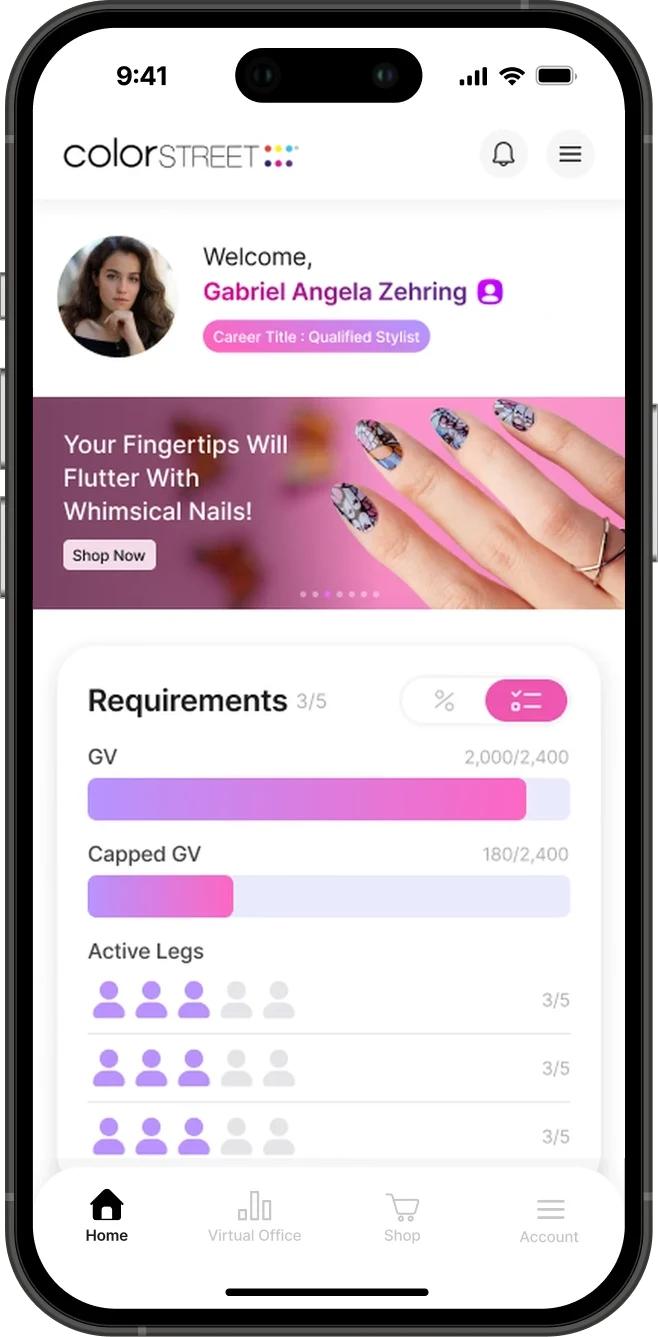
"Where do I stand?"
Rank progress leads. Rank is the goal users work toward, but it was buried among other charts. Putting it first answers the most important question at a glance.
"What do I do next?"
Requirements, one tap away. A percentage shows distance, not action. Breaking the next rank into specific targets turns progress into clear next steps.
"What can I reach this month?"
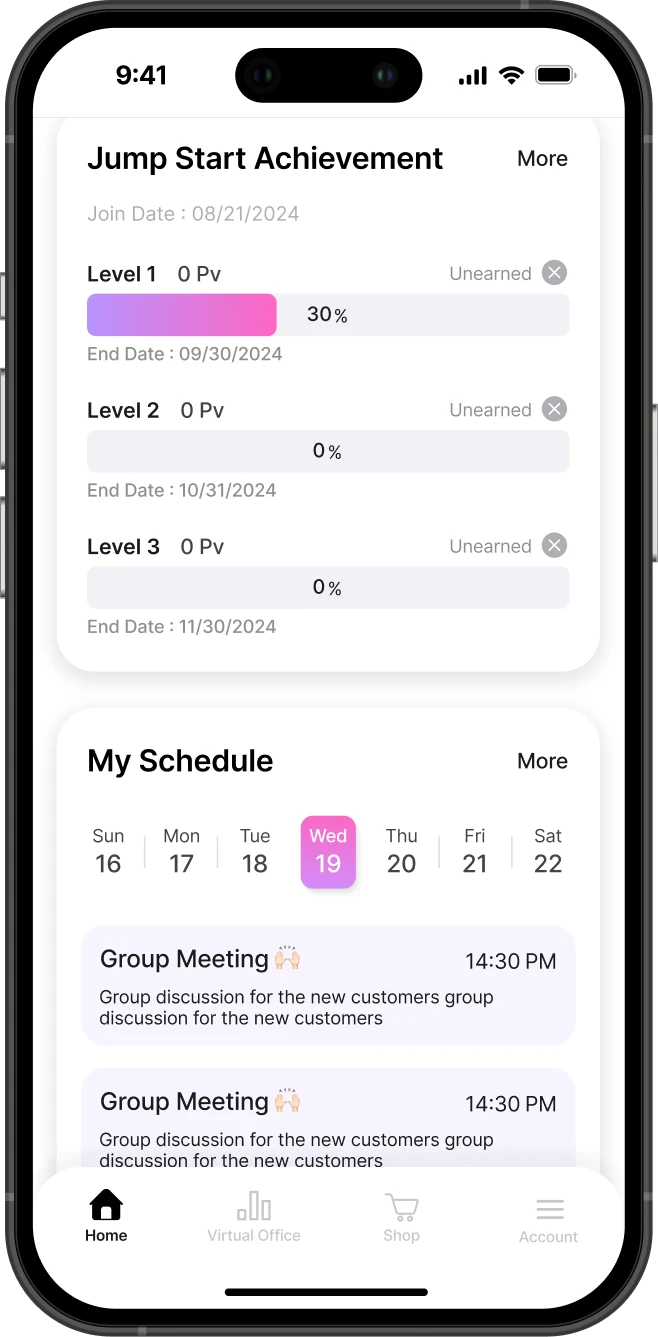
Short-term achievements. Rank goals can take months. Monthly levels with deadlines create nearer goals that keep momentum going.
"What's coming up?"
This week on Home. Upcoming events appear without opening the calendar, so planning fits into a quick check.
Business goals vs. user goals
The company needed Home to promote new launches, while users open it to check their progress. One launch banner sits above rank progress, and other company news moved lower.
Home isn't about showing all the data. It's the right data, in the right order.
Field Research
Field research revealed the key motivator: recognition.
At the company's national conference, users wore rank badges on their lanyards with pride. Others noticed, compared and asked about them.
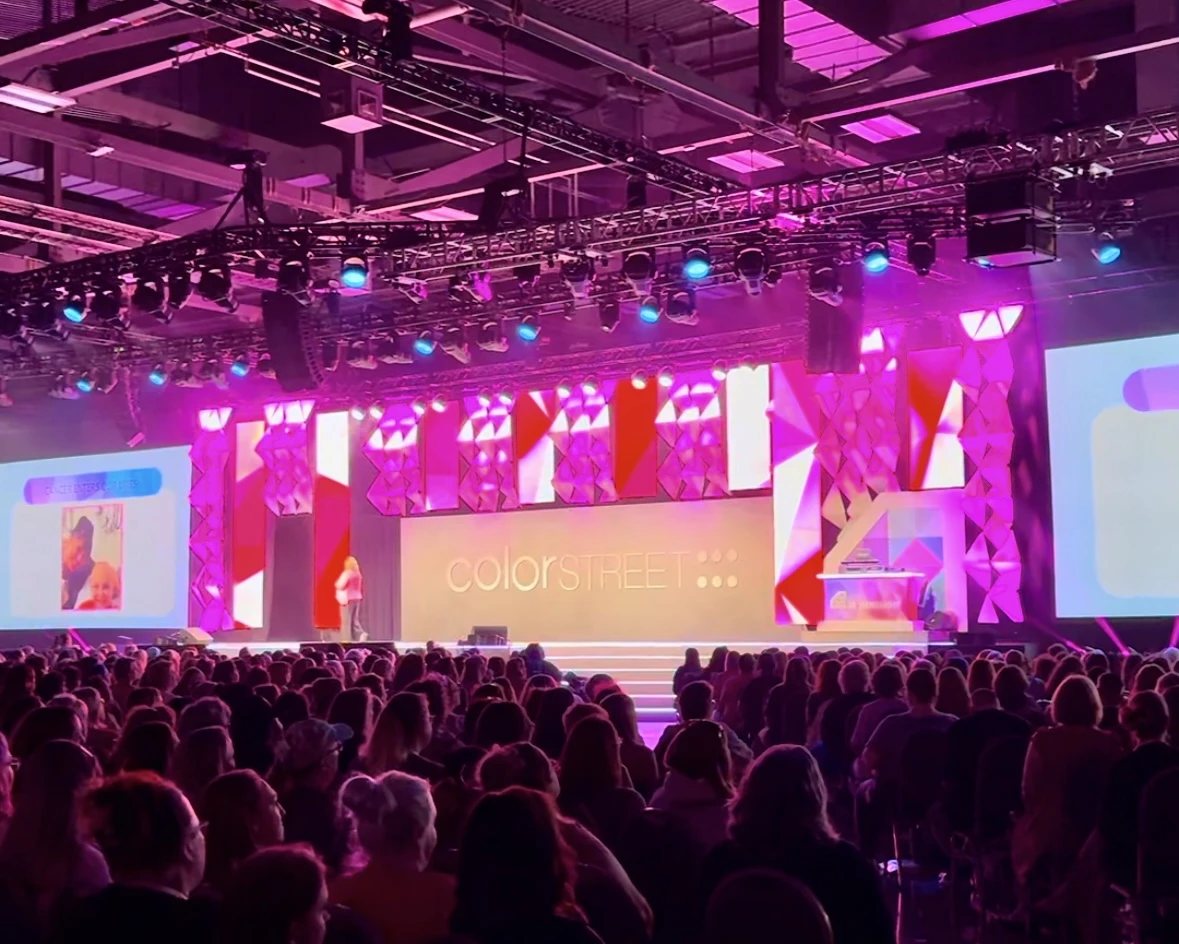
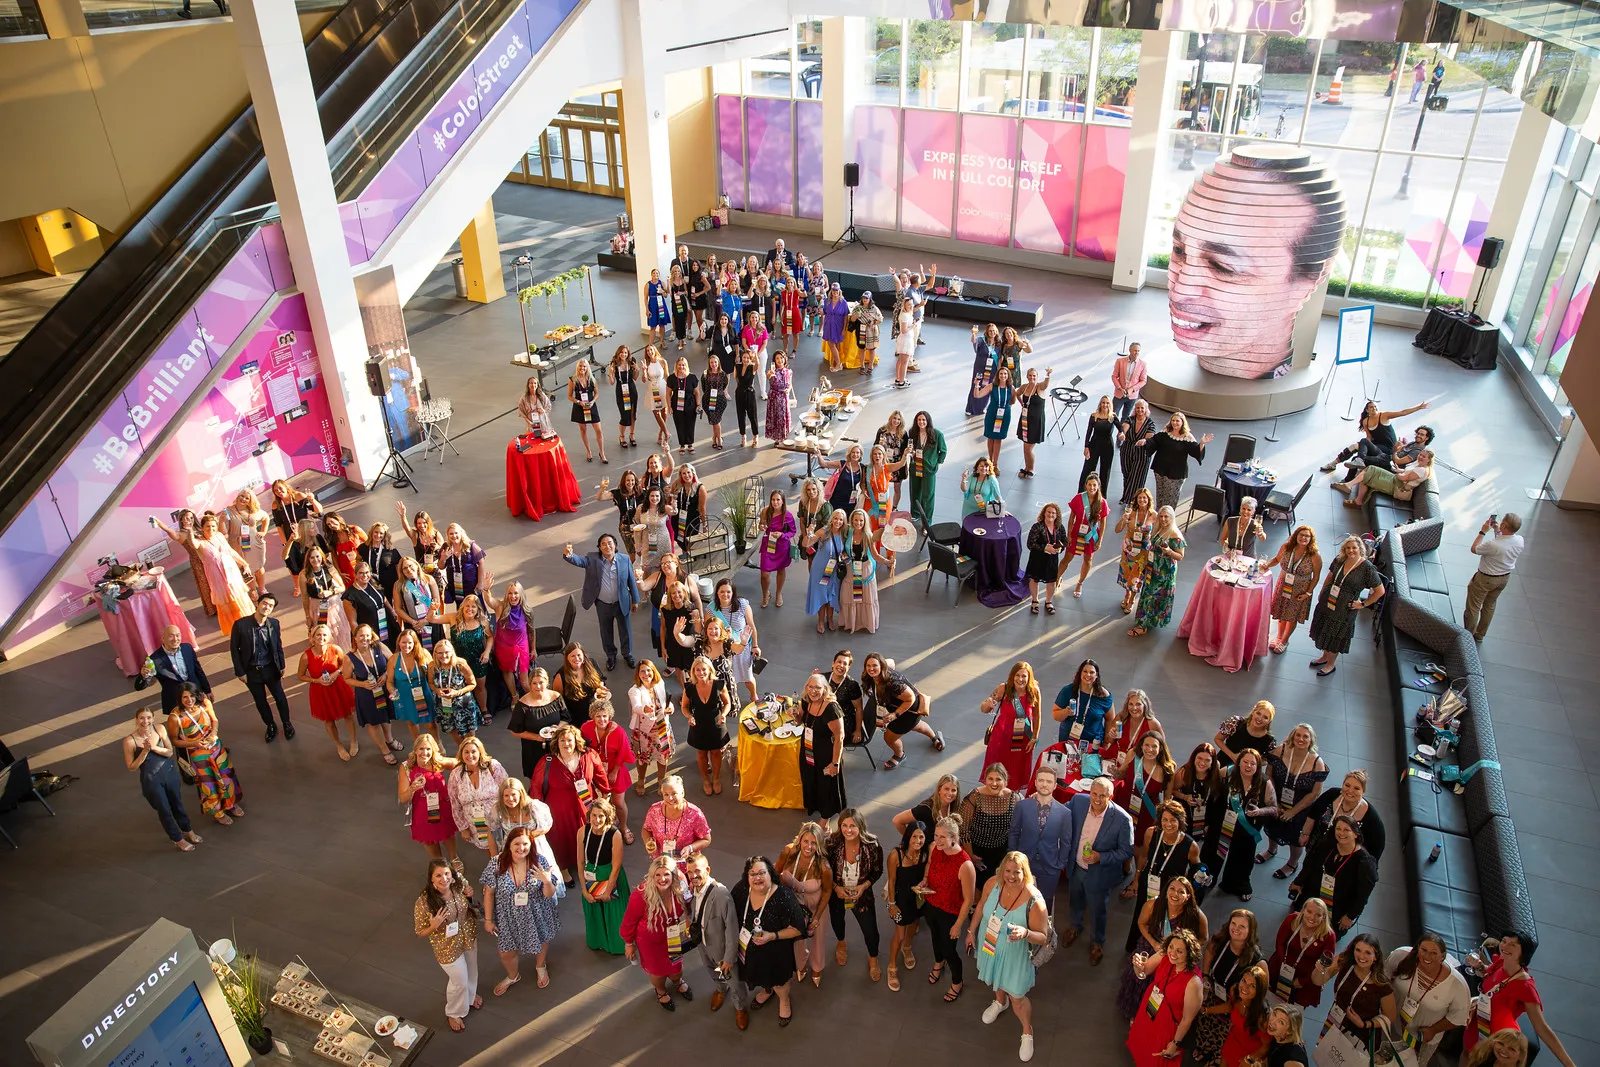
On the web platform, hitting a new rank was just a text change.
From observation to feature
The pitch I made to the team
If a physical badge at a once-a-year event got people this excited, an in-app version could do it all year!
Rewards
Turning achievement into visible recognition to drive motivation.
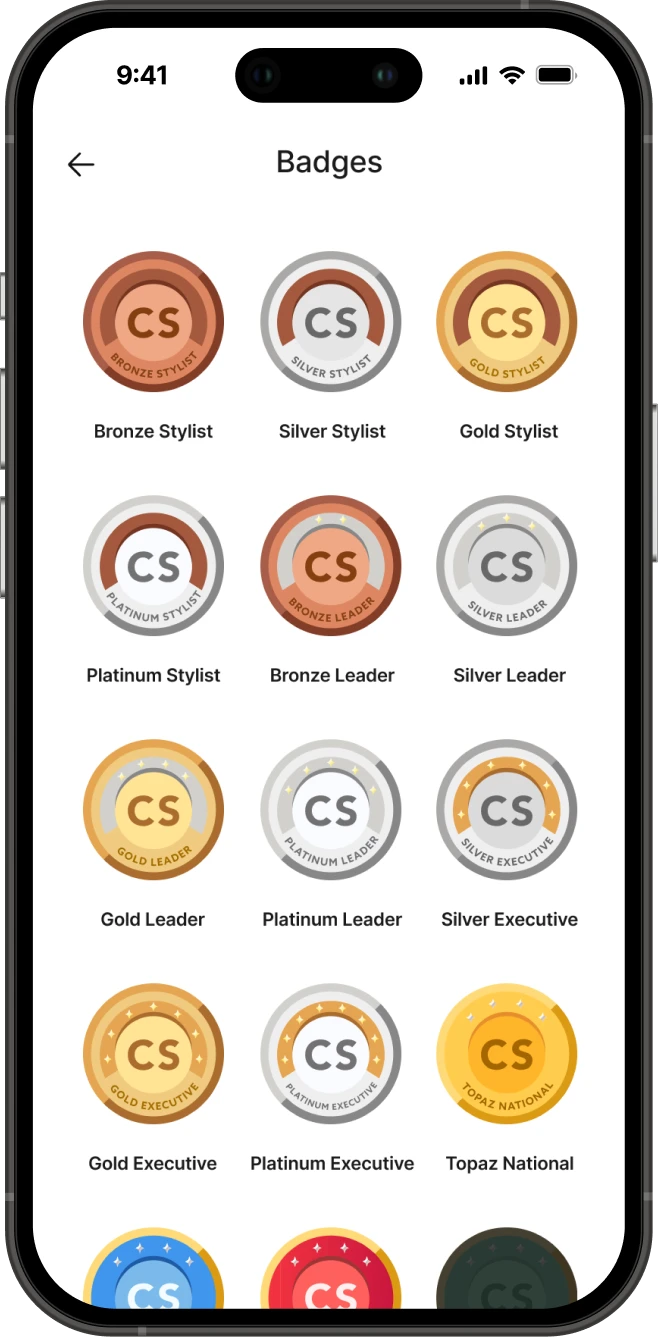
Badges turn rank, the company's core motivation system, into something users can see, collect and show.
Engagement Features
Designing for re-engagement, not just usability.
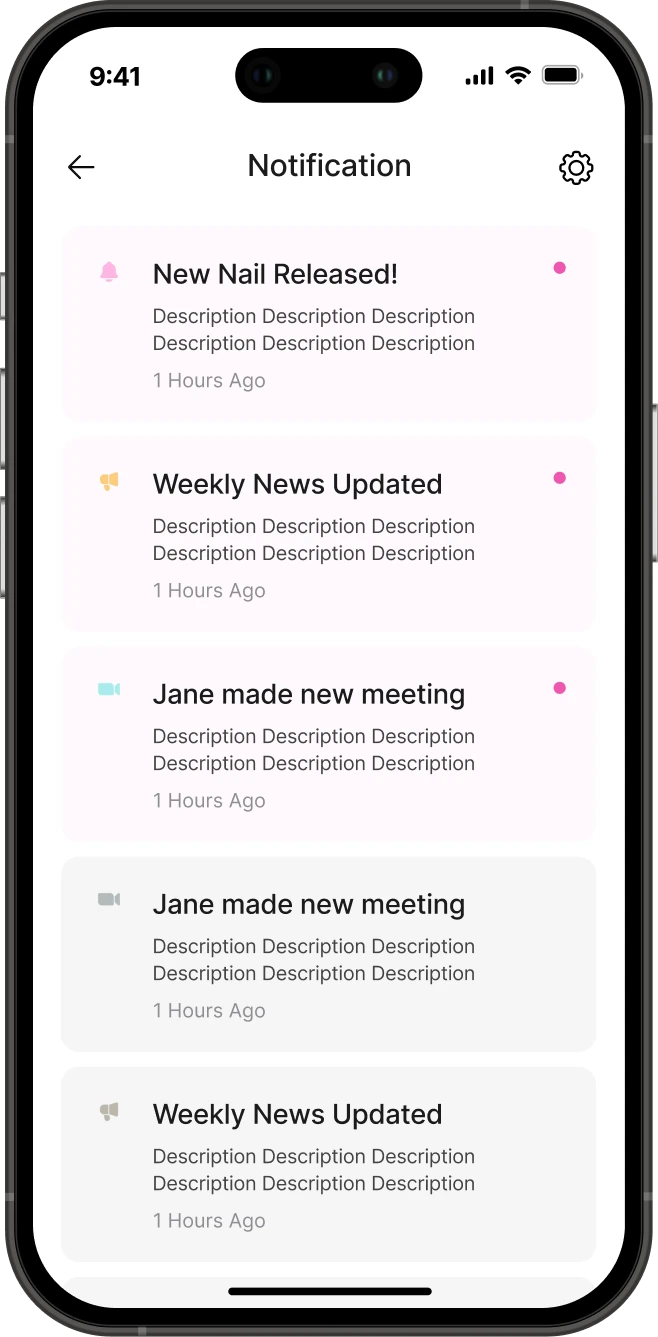
A better-looking app is easier to use, but it doesn't give people a reason to open it. The platform waited for users to remember to check in. Calendar and notifications let the app reach out first.
How calendar and notifications work together
Impact
Shifting the product from a data dashboard to a motivation-driven app.
Redefining what the app was for changed what got built, and how users relate to it.
Reflection
What I'd do differently
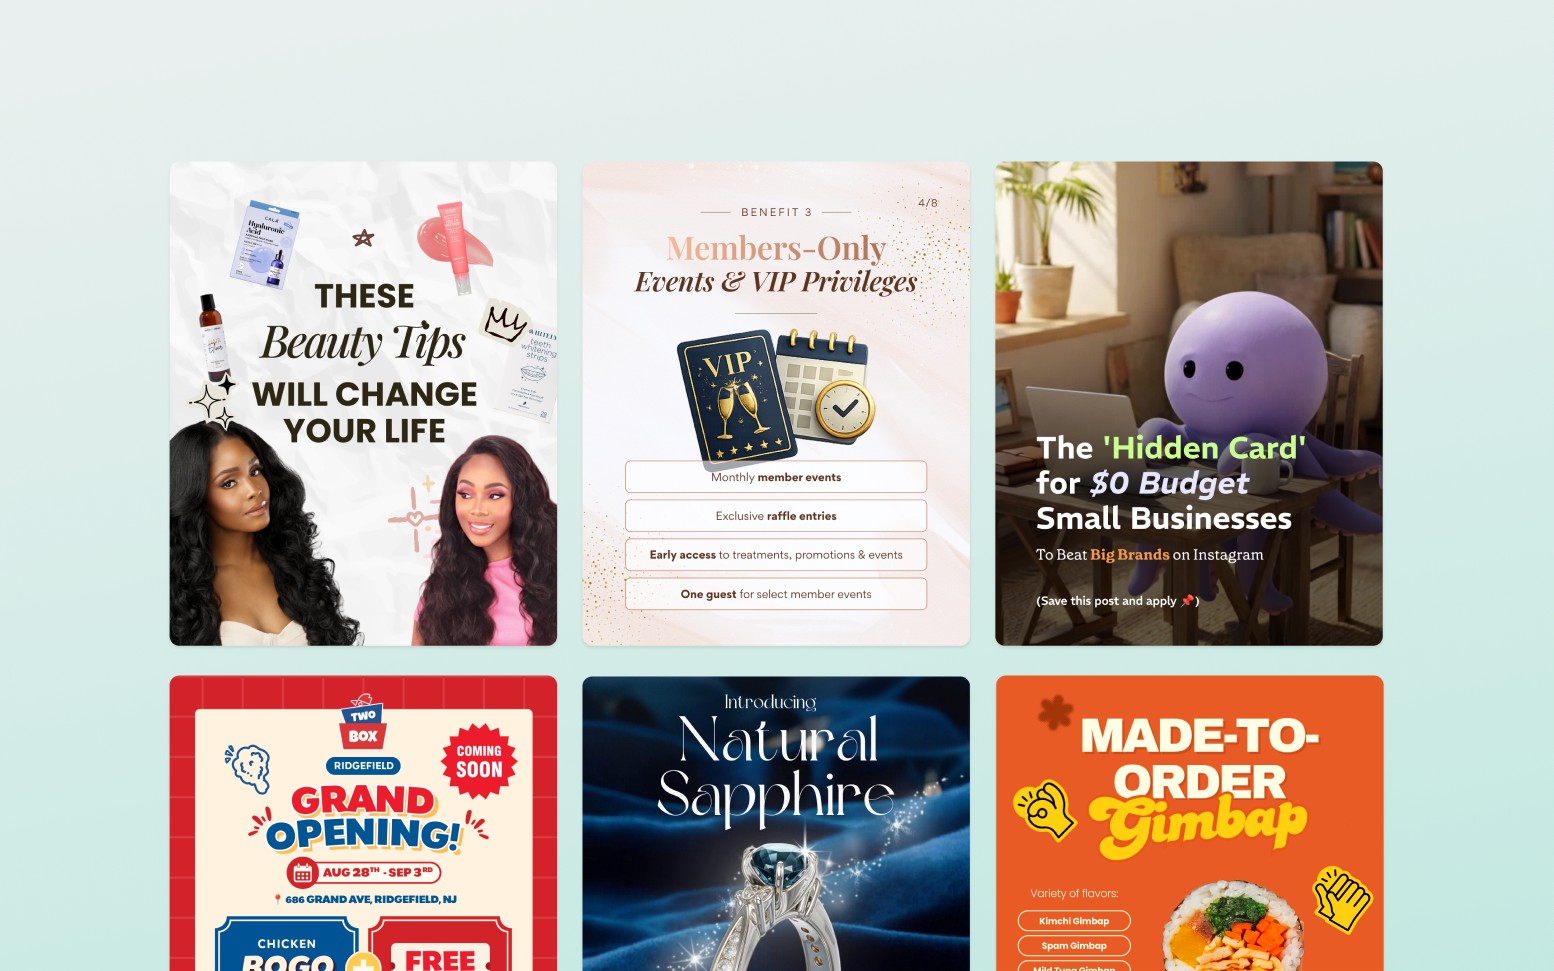
Designing Graphic Assets Across Multiple Client Brands
Overview
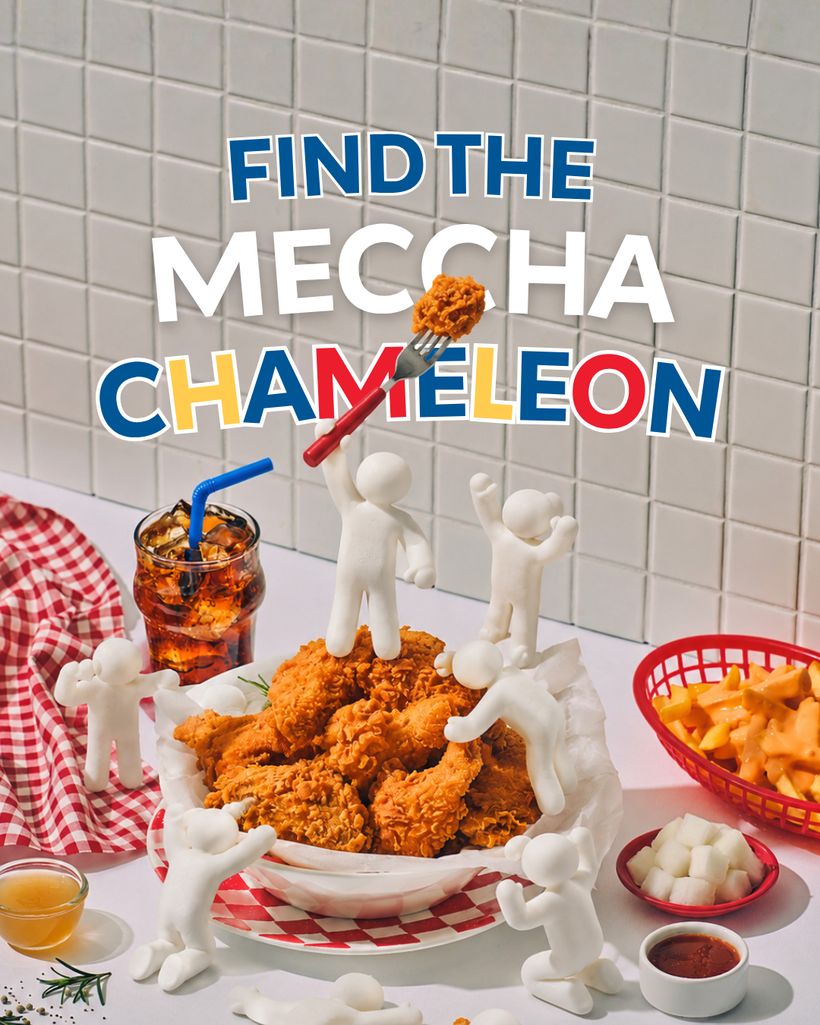
Campaign, social and print design for clients running concurrently — each with its own type logic, palette temperature and density, because the audiences have nothing in common.
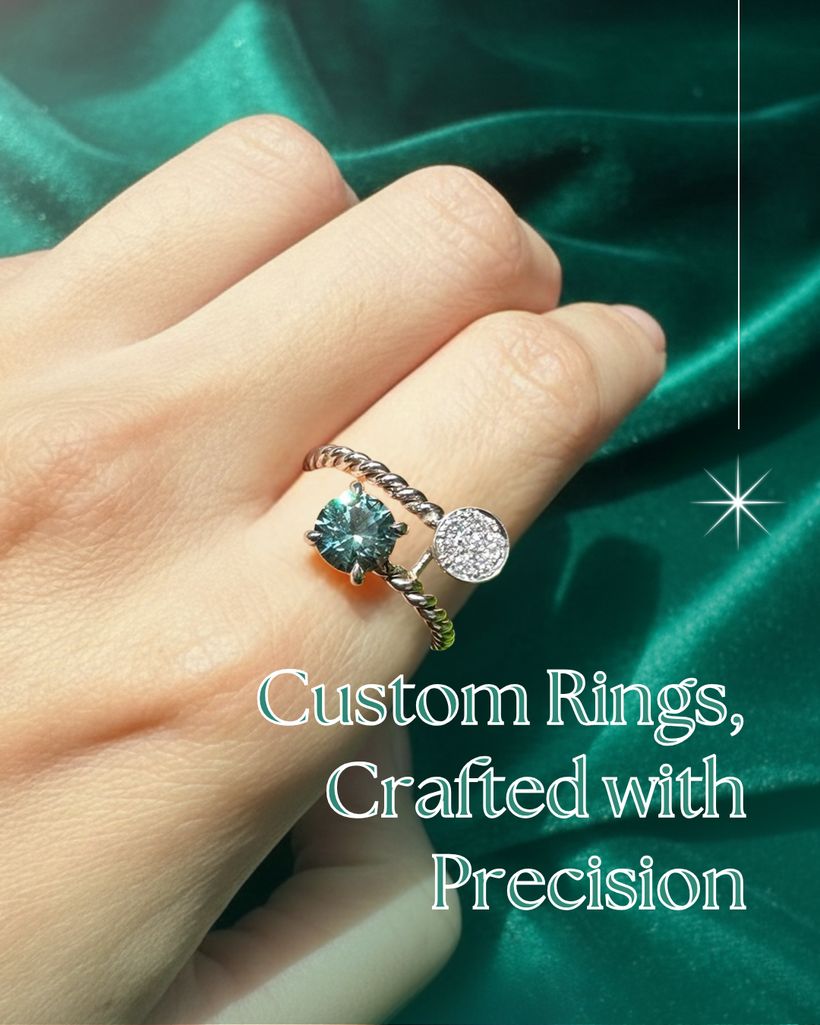
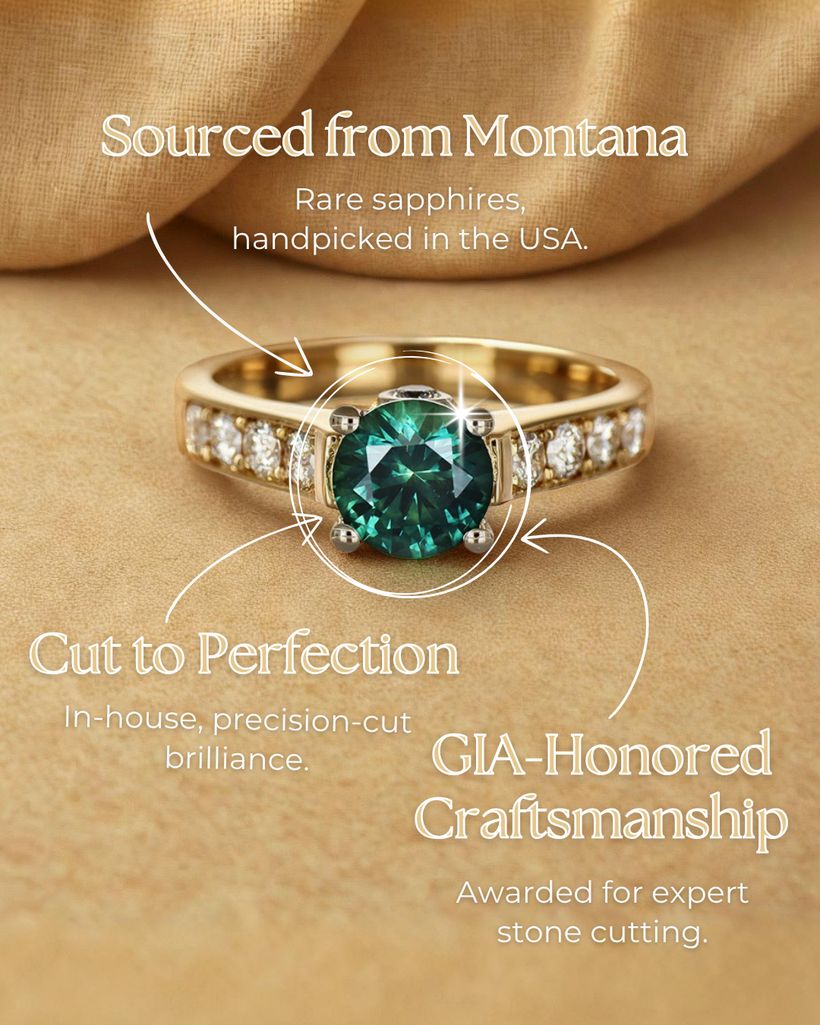
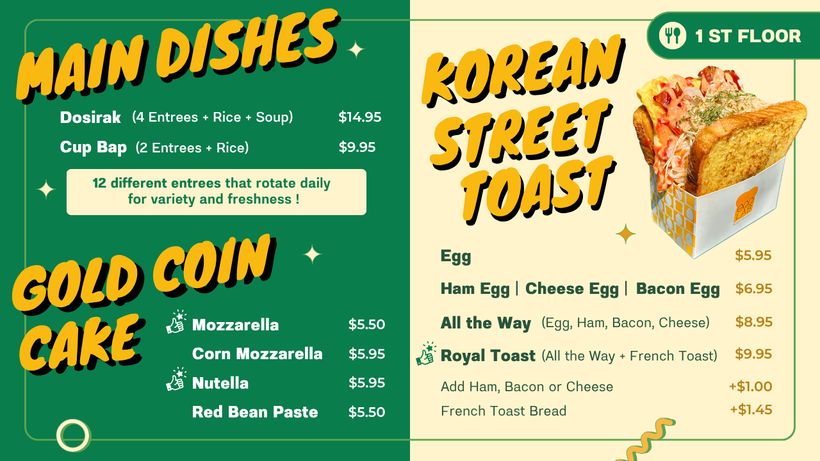
A selection of the work I'm most proud of, drawn from a larger roster. Fine jewelry, Korean BBQ, a skin clinic, a beauty retailer, a grocery brand and a software product all shipped in the same weeks, and the discipline is keeping each one recognisably itself. Most arrived without a usable identity, so each piece also quietly sets the rules the next one follows.
What I did
- Set a distinct visual direction per client — type, palette, density, photographic treatment
- Shaped headline copy alongside layout, rather than fitting type around finished text
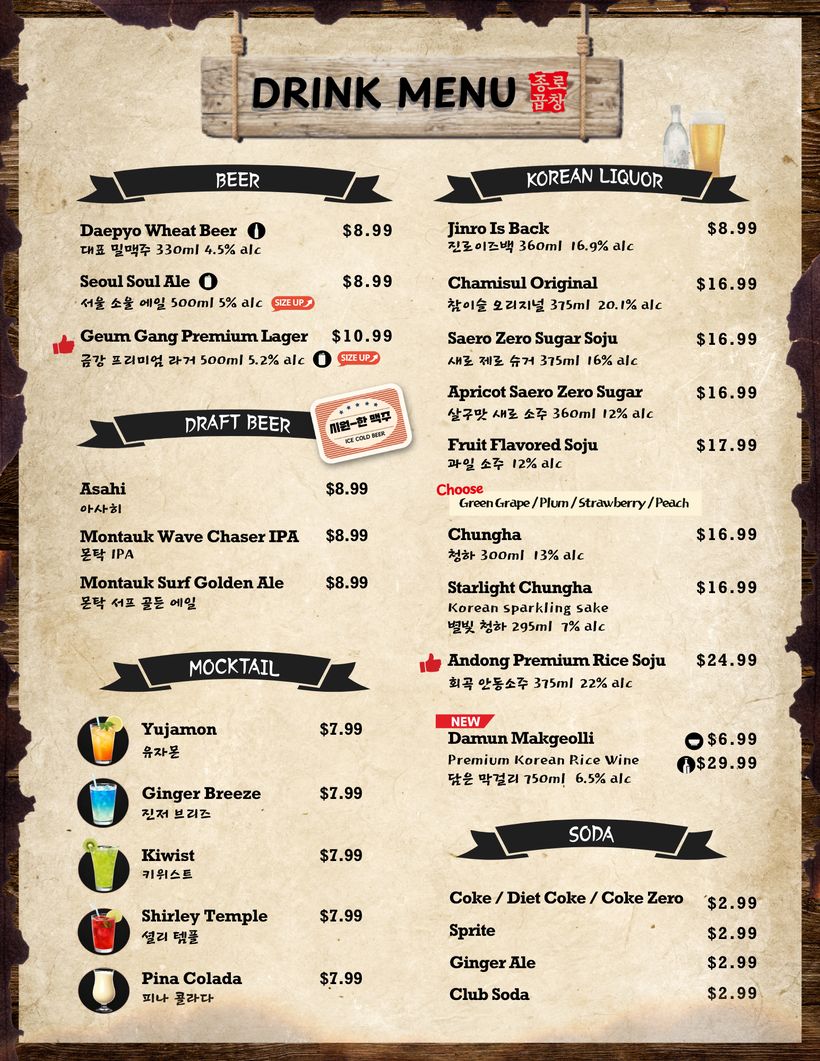
- Produced print work to spec, including full food and drink menus
- Built reusable templates so each direction survives a fast turnaround
My impact
Every brand below reads as its own — and stays that way across months of campaigns, because the direction is written down in the work rather than carried in someone's head.
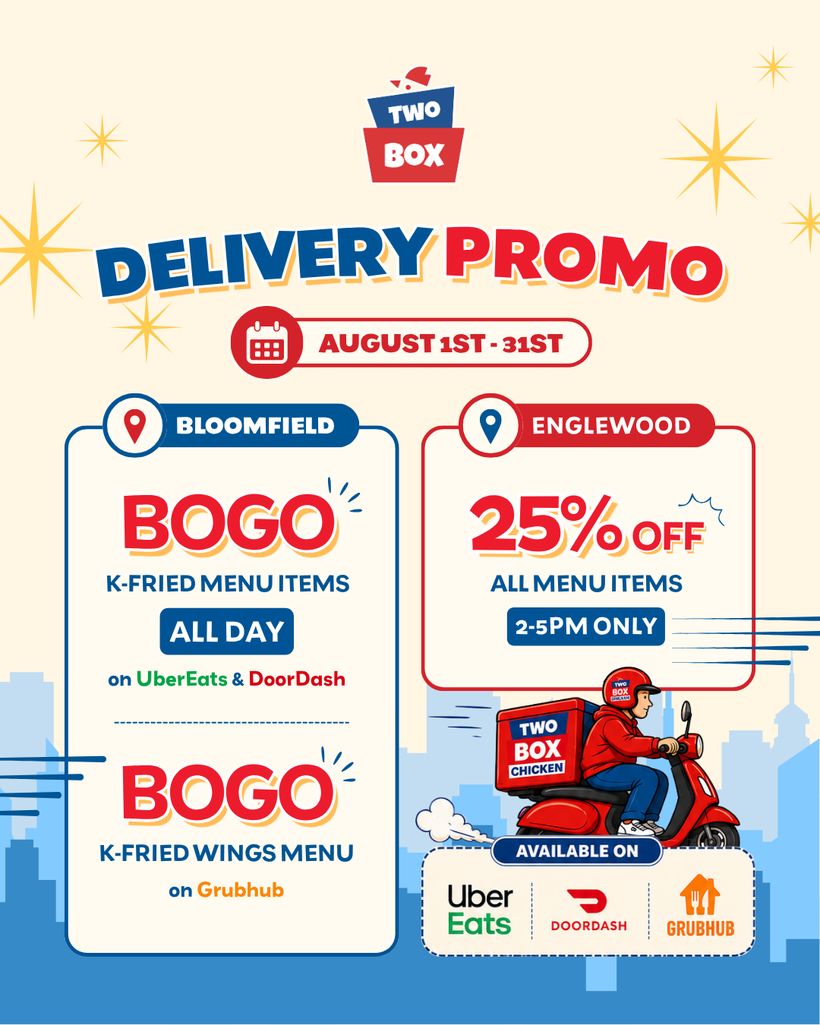
Two Box
restaurant · Social media promotional Contents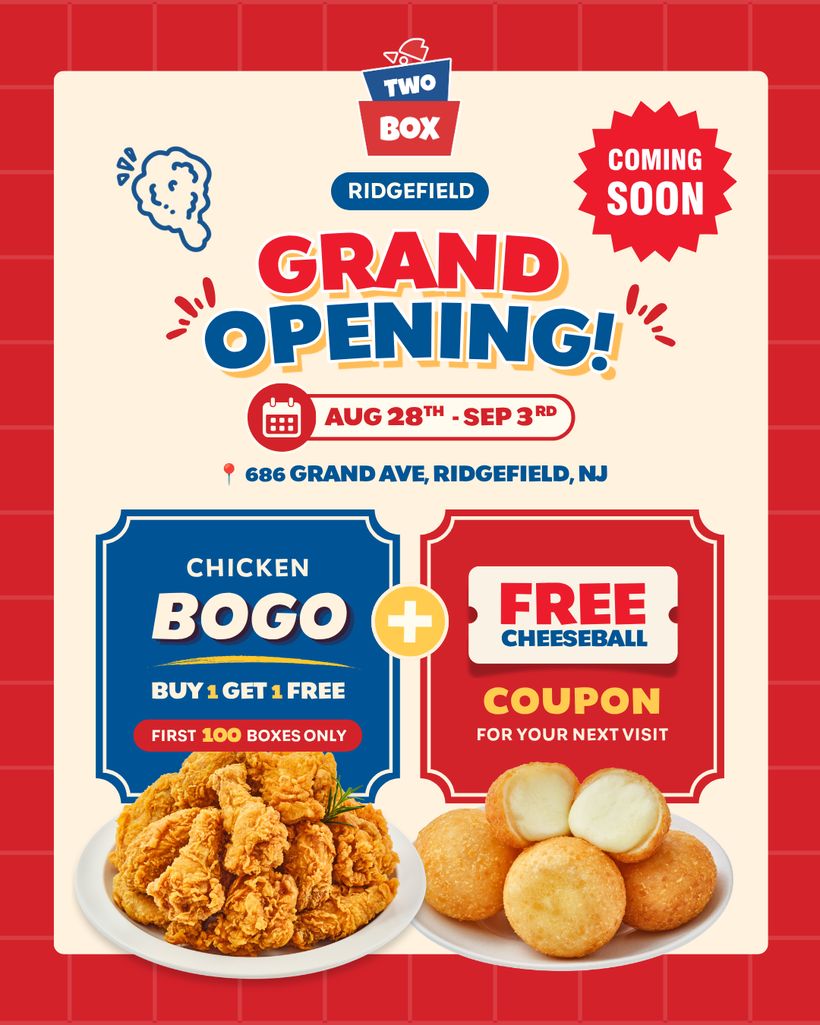
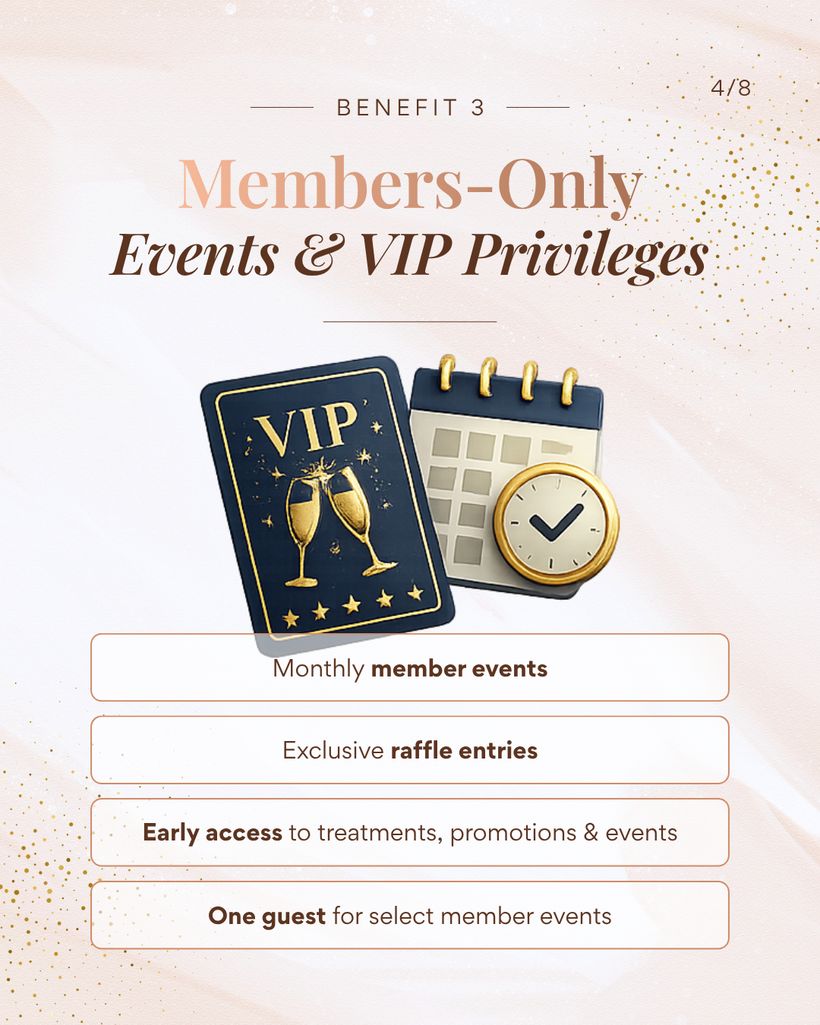
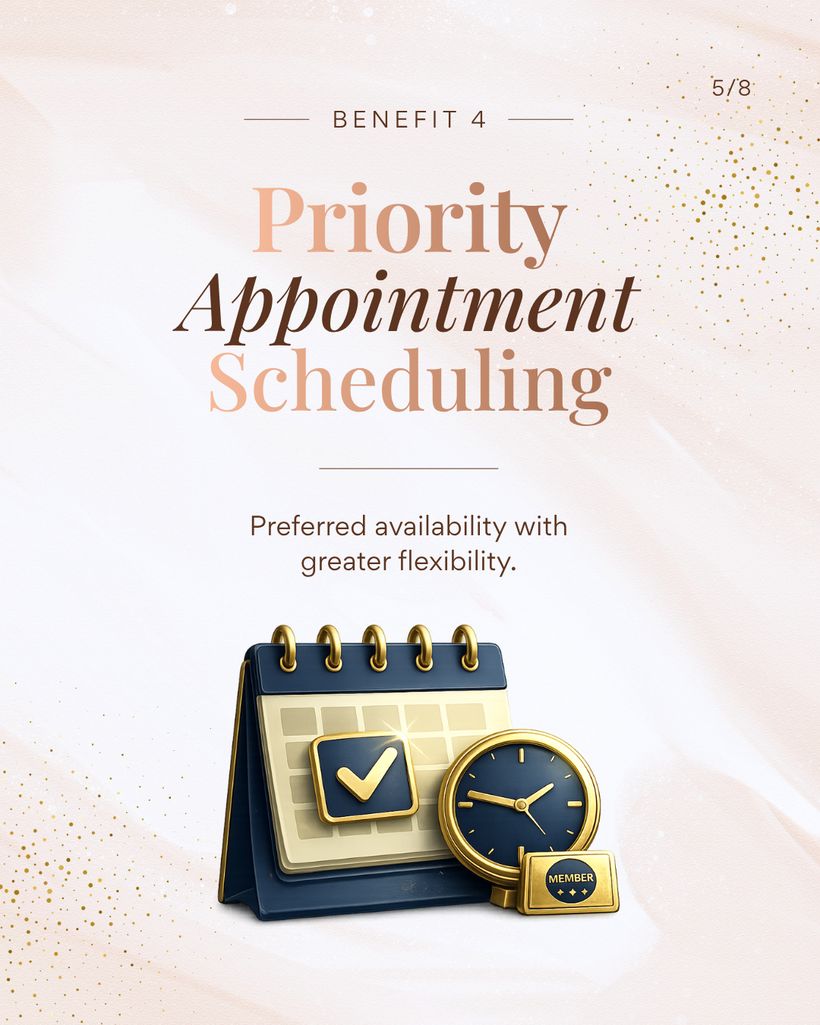
Clear Laser Skin Clinic
Medical aesthetics · Social media promotional Contents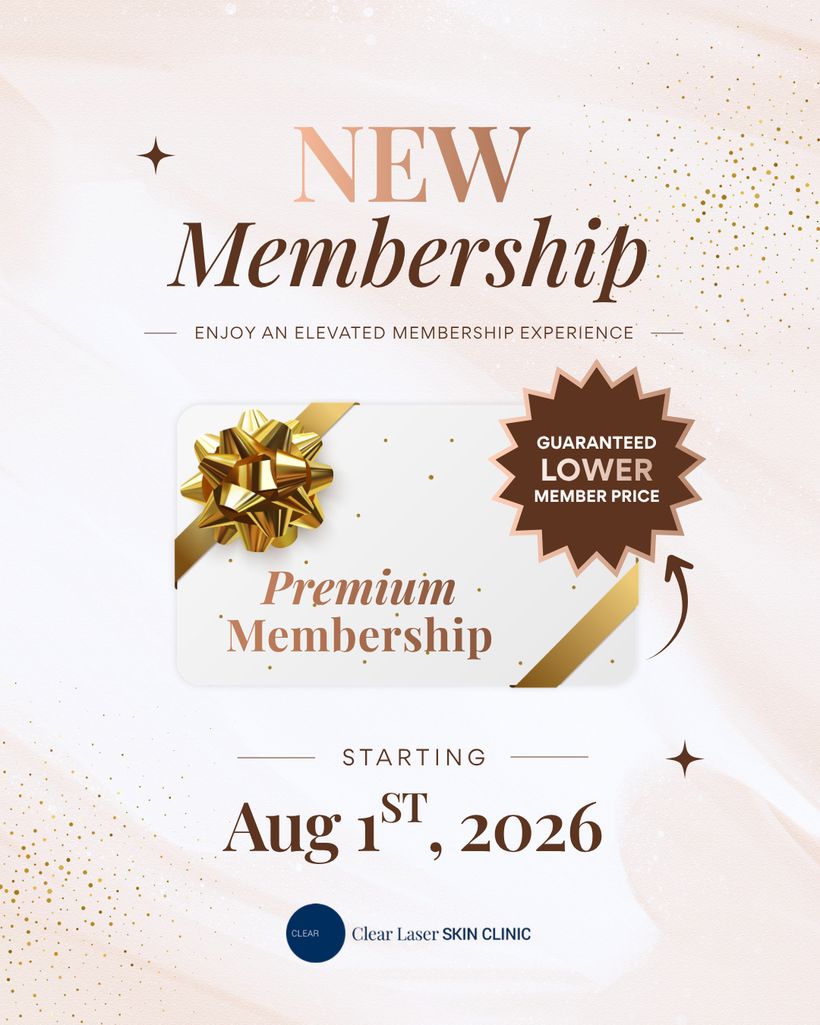
The Sapphire
Fine jewelry · Social media posts
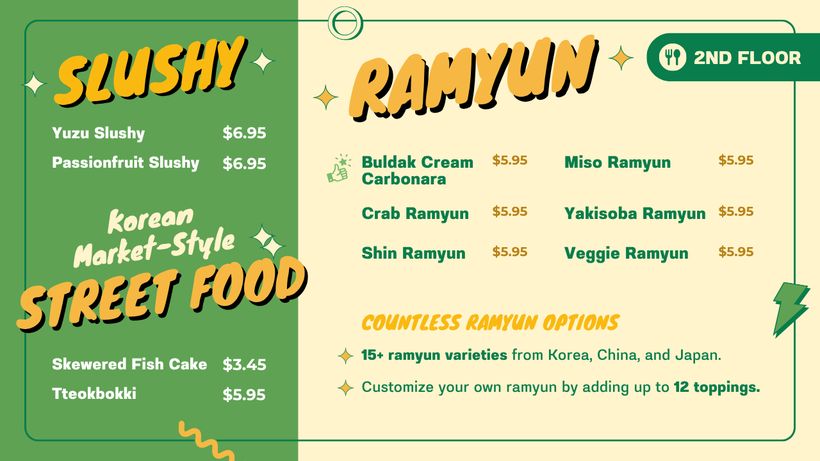
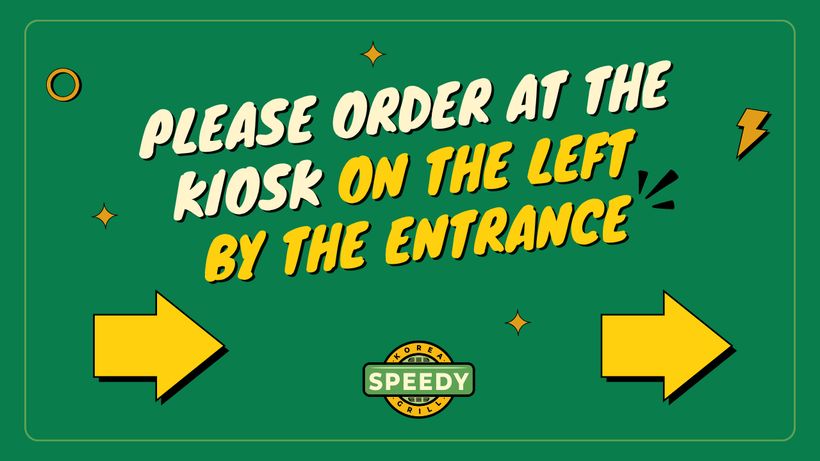
Speedy Korea
Fast Food · digital menu graphics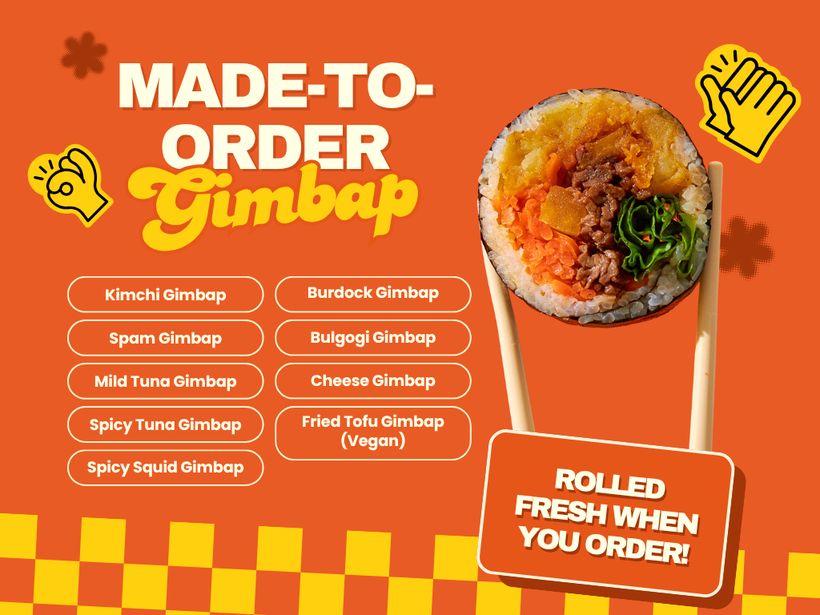
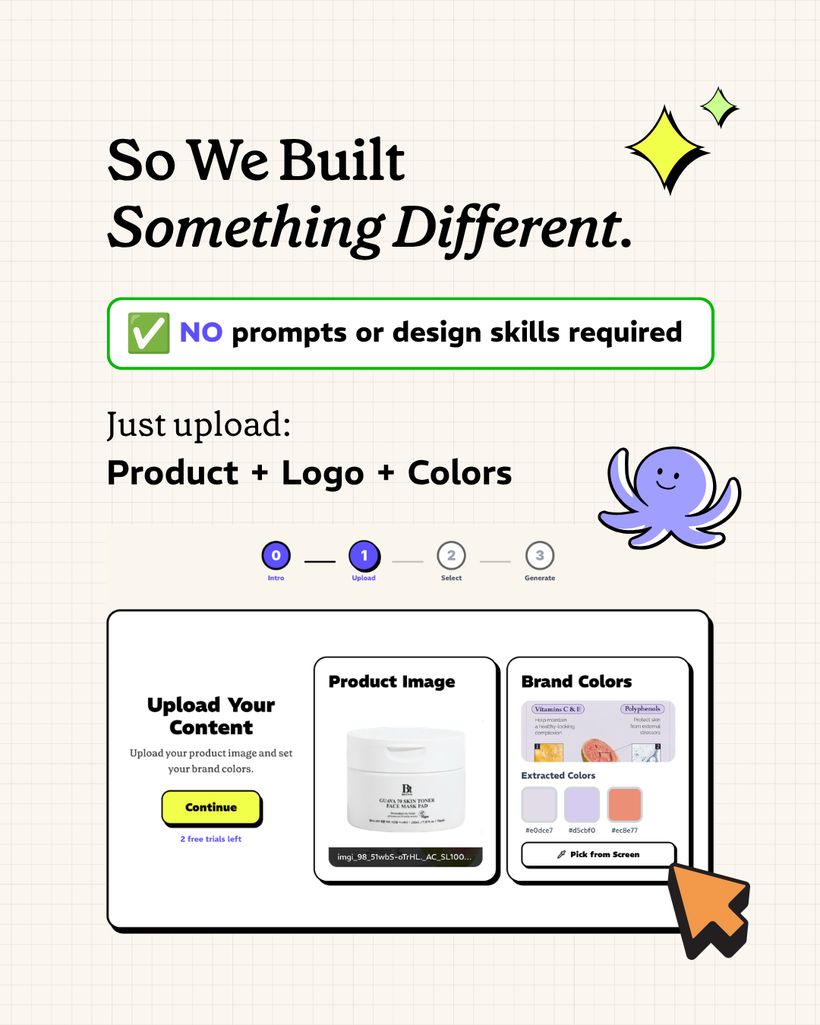
Olliz
AI content platform · Social media posts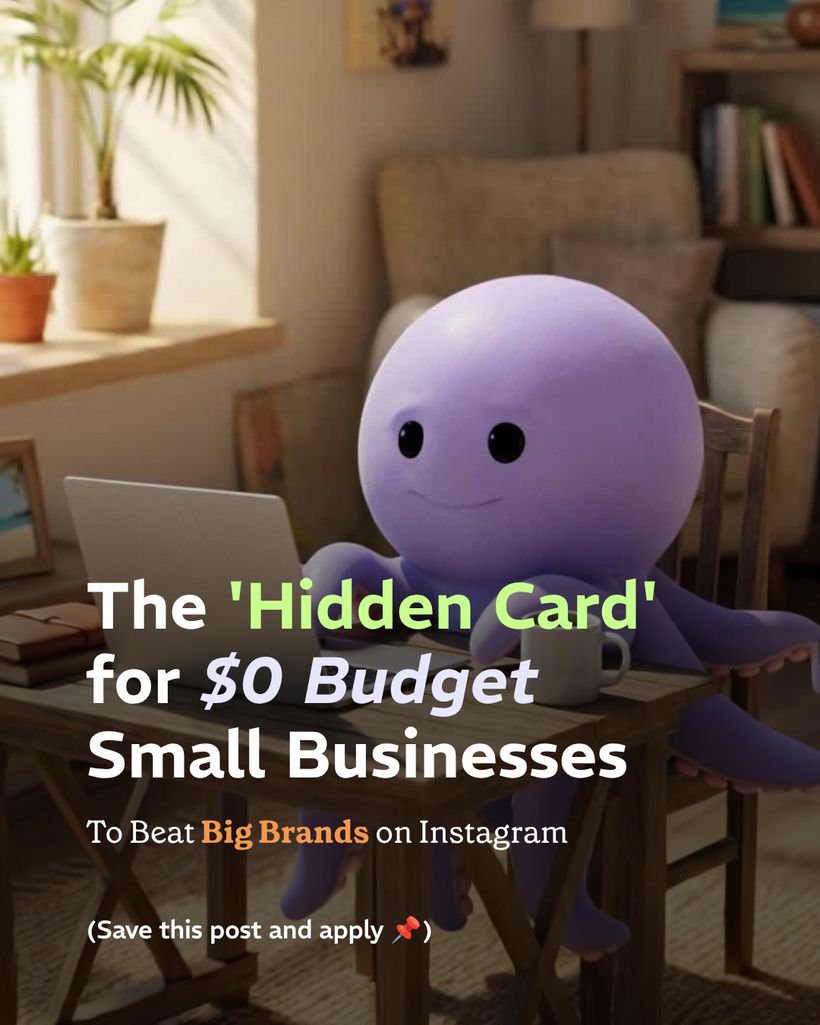
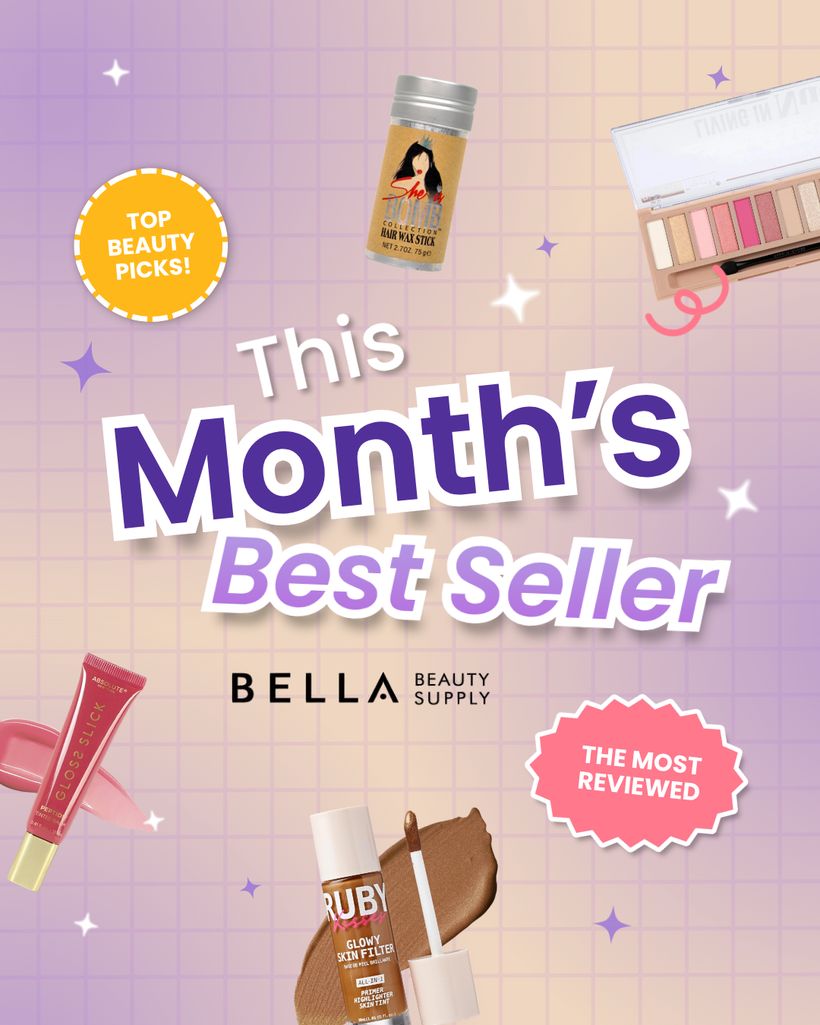
Bella Beauty Supply
Beauty retail · Social media posts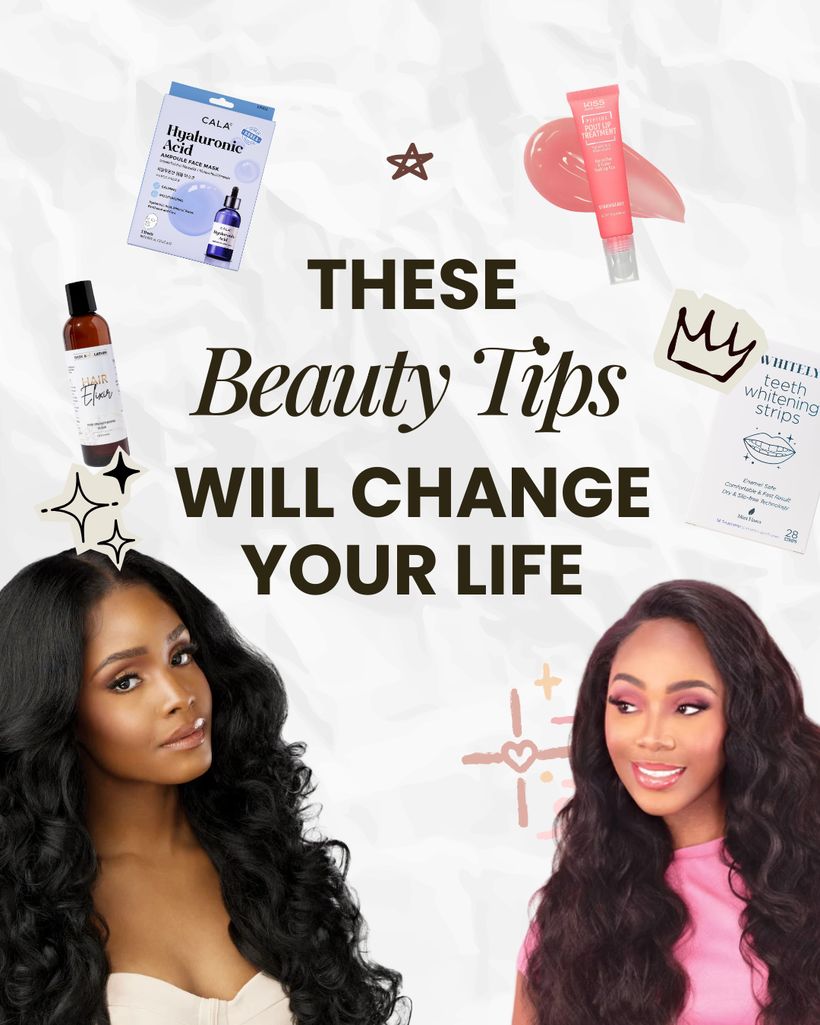
Jongro BBQ
restaurant · Print menus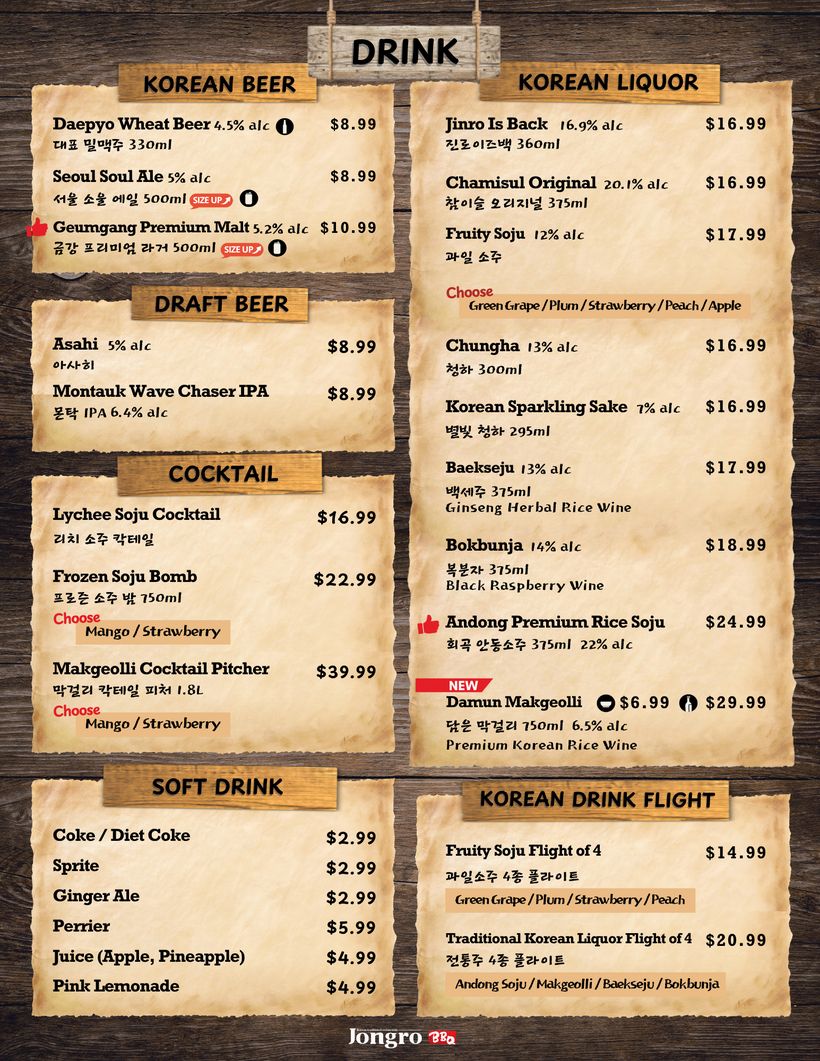
Play
Side quests & things I do for fun :)

About
Hi! I’m Marion, a product designer based in NYC
I work across product, websites and design systems, and what connects them is the same question every time: what is this supposed to accomplish, and is it doing that?
Currently a design lead at HeyBoss Technologies, a digital design agency in NYC, where I design products and websites and help our design team grow. I love communicating through visuals, and working across so many different businesses has taught me to read a business quickly and design for what actually moves it. I work hand in hand with AI, and I care just as much about making the process better as making the product better.
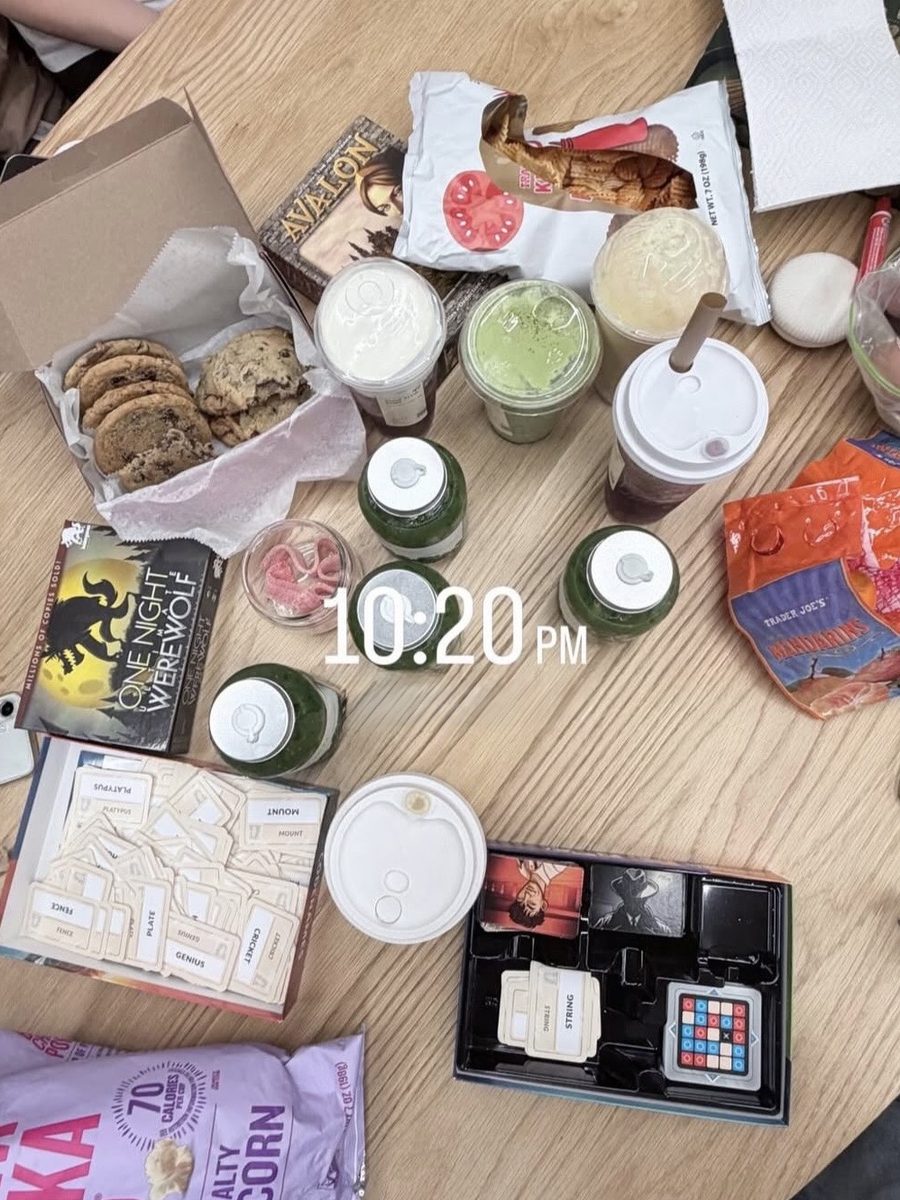
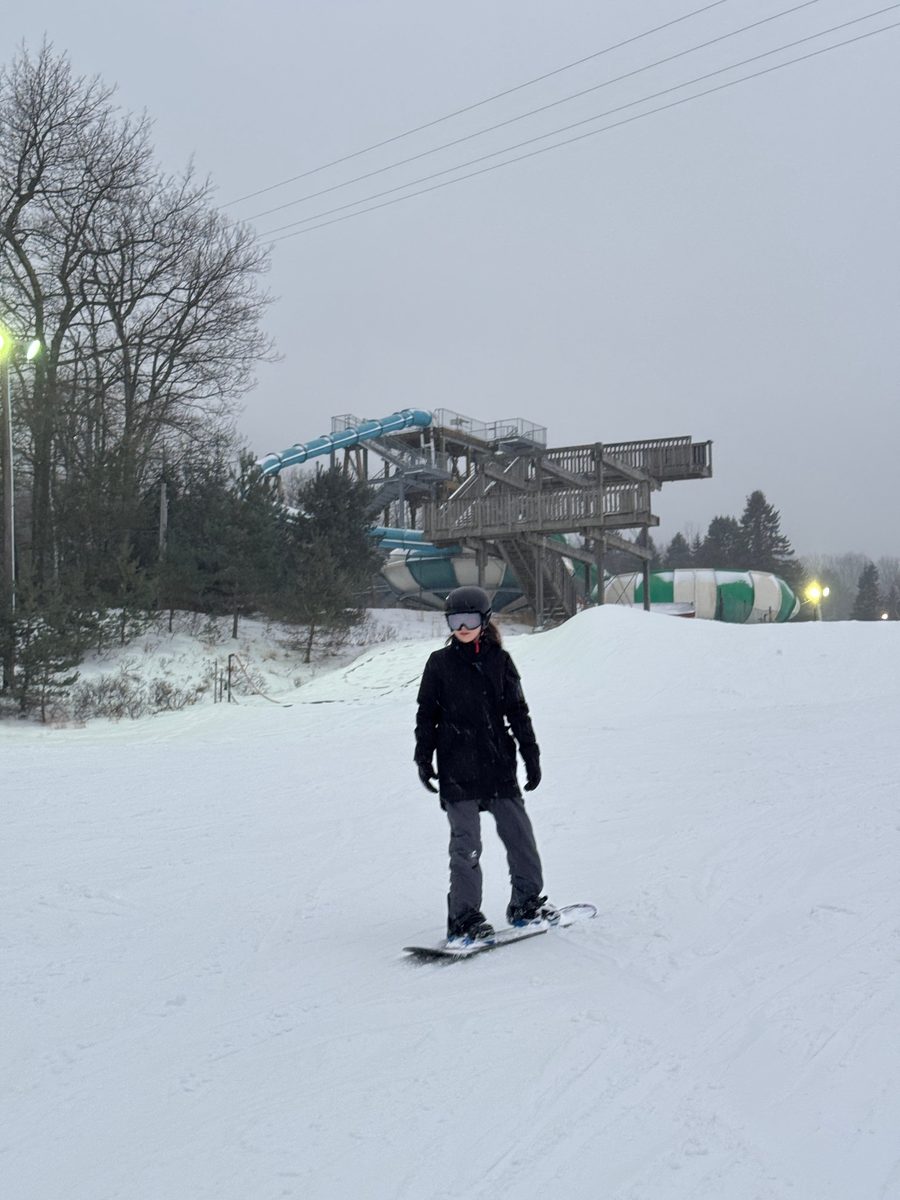
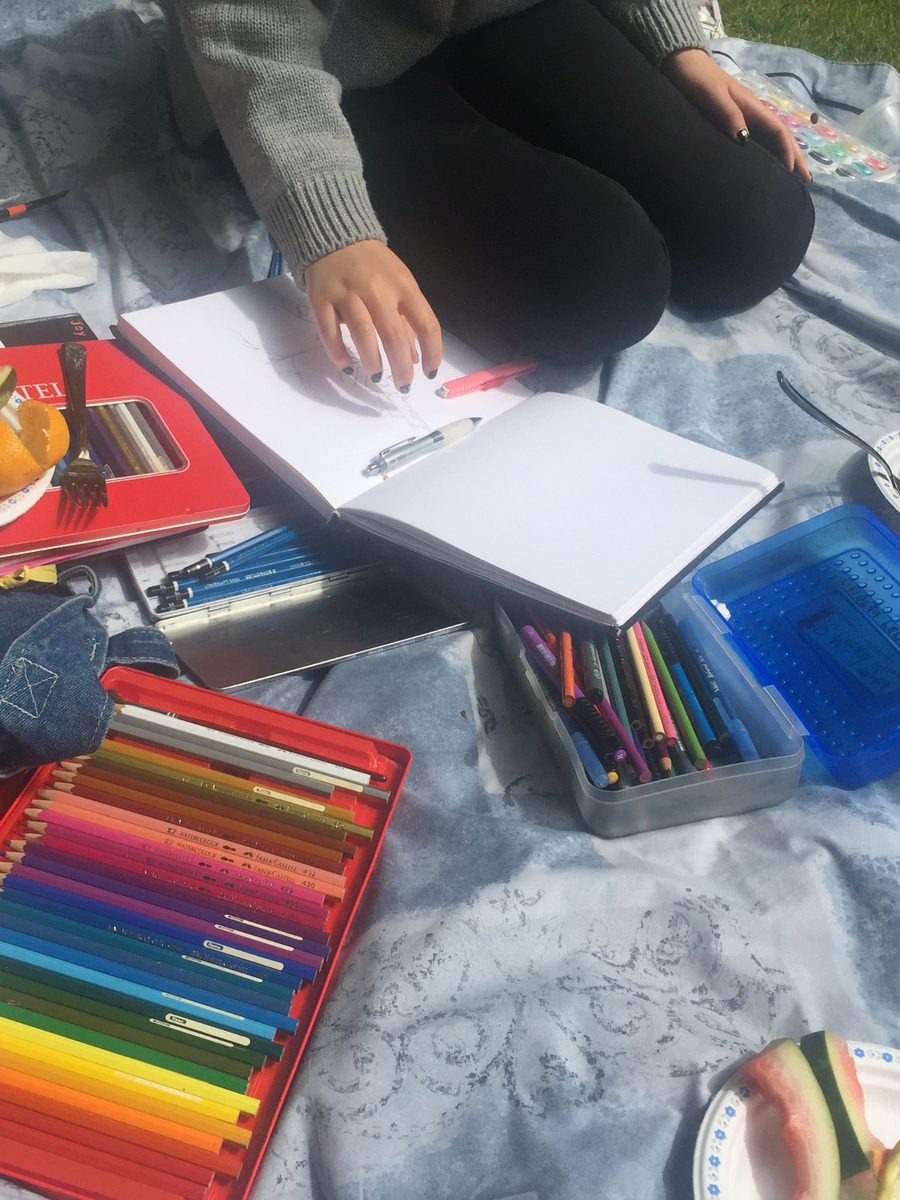
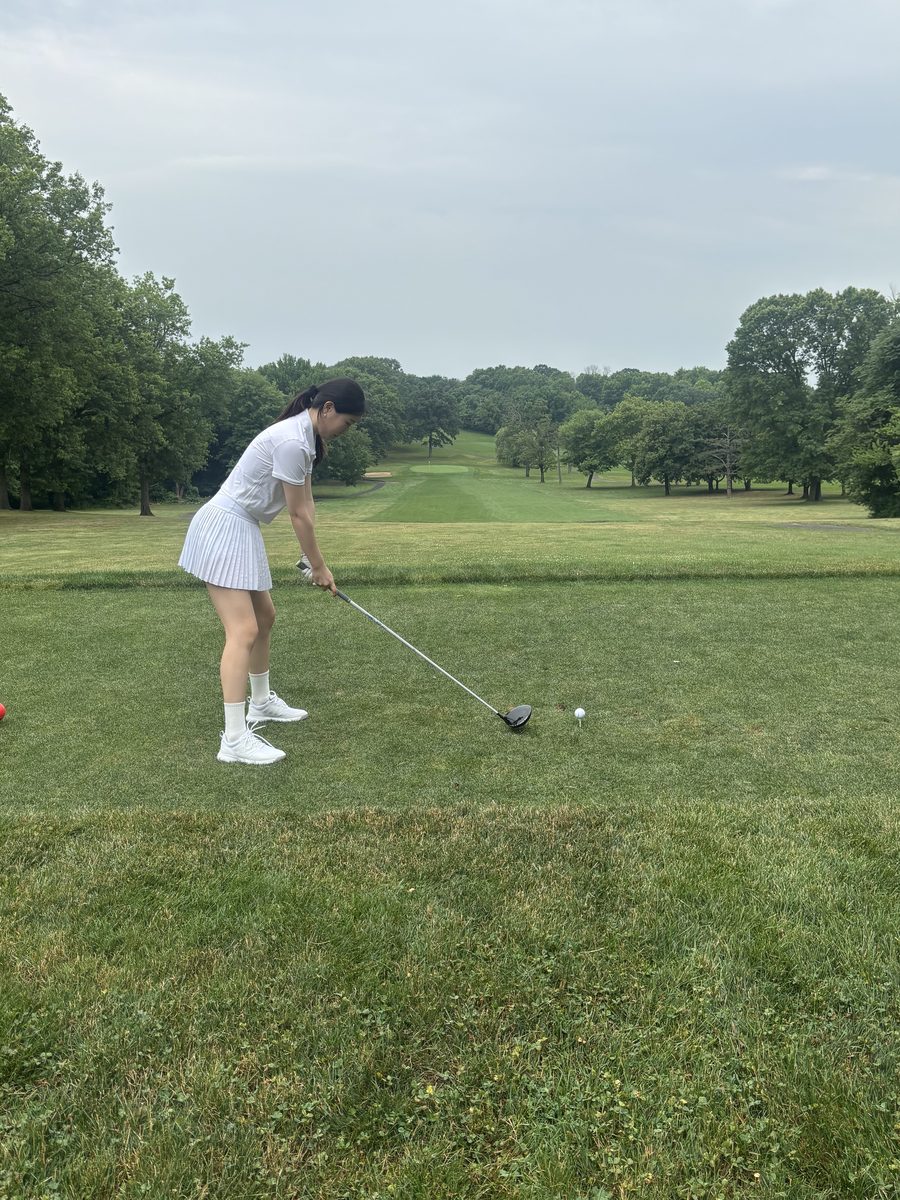
I grew up in Vancouver, Canada, snowboarding and blueberry picking on weekends, eating lots of poutine but forever dodging the rain... These days you’ll find me at game nights with friends playing Avalon, our current favorite, out on the golf course as a very new golfer, or drawing and painting just for fun!